In my classes and research group, I work with many novice R users who ask a
plethora of great questions. Some of the common questions include things like,
“Why do you have to quote a package name when you install it but don’t you have
to quote it when you attach (i.e. load) it?” Or, “How do you know which package
a function comes from if you don’t use the double colon, i.e., ::?” These
sorts of questions indicate that students are comprehending the material,
learning the language, and beginning to recognize important patterns.
In my classes, we frequently dissect documentation and comb over function
arguments. Students are often curious about how certain arguments will affect
the way a function runs, and they routinely vocalize these inquiries. Questions
about the ellipsis – the ... used in many R functions – however, almost
never come up. It is treated like a mysterious artifact that ought to be
avoided.

Or perhaps students suspect the power of these dots – much like the Army of the Dead in Lord of the Rings – but seek to avoid unnecessary risks.

Since I rarely have students utilize arguments that are not explicitly listed by a high level function, maybe they assume it isn’t relevant and is more of a comical catch-all like how “et cetera” is used in movie The King and I:

This is despite the fact that many functions my students see indeed have the
ellipsis in their documentation. To be fair, while I had been aware of the
ellipsis for quite a while, I had avoided it in my own function creation much in
the way the miners in Dead Space should have avoided the Artifact. In a recent
project, however, I found the ellipsis – along with extracting and manipulating
objects created from it – to have incredible value for one task in particular:
constructing helpers and wrappers with sensible defaults around functions like
those in ggplot2 where there are many optional arguments.
Yet, even for intermediate to advanced R users, there may be some unexpected
behavior of the ellipsis, or “dots” (e.g., ...), particularly in debugging
functions, that I never would have expected otherwise. I really heavily on
debugging and Emacs’ ESS functions when creating R packages, and though there is
a great introductory blog post on creating functions with the ellipsis
here, it
neglects debugging considerations (and memes), so I wrote this post to fill that
gap. I contend that the ellipsis is more like Figure 2 than it is like Figure 1
or Figure 3. It allows for a convenient way to construct functions that pass
user arguments to other functions, particularly when the function creator wants
to supply reasonable defaults yet allow these to be changed. Fortunately, one
need not be Gondorian royalty to wield it’s power, but you have to overcome some
debugging hurdles.
Functions for everyone
For my Quantitative Methods in Geography class, I created a package called
haffutils that contains numerous functions intended to lower R’s barrier of
entry for beginners. This reduces the amount of code that students have to write
and makes data analysis and visualization simpler. One function that students
use is designed for creating density plots. Aside from the function I created,
there are two common ways to create a basic density plot. One (a) involves
using functions from the built-in base and stats packages:
x <- rnorm(100)

plot(density(x))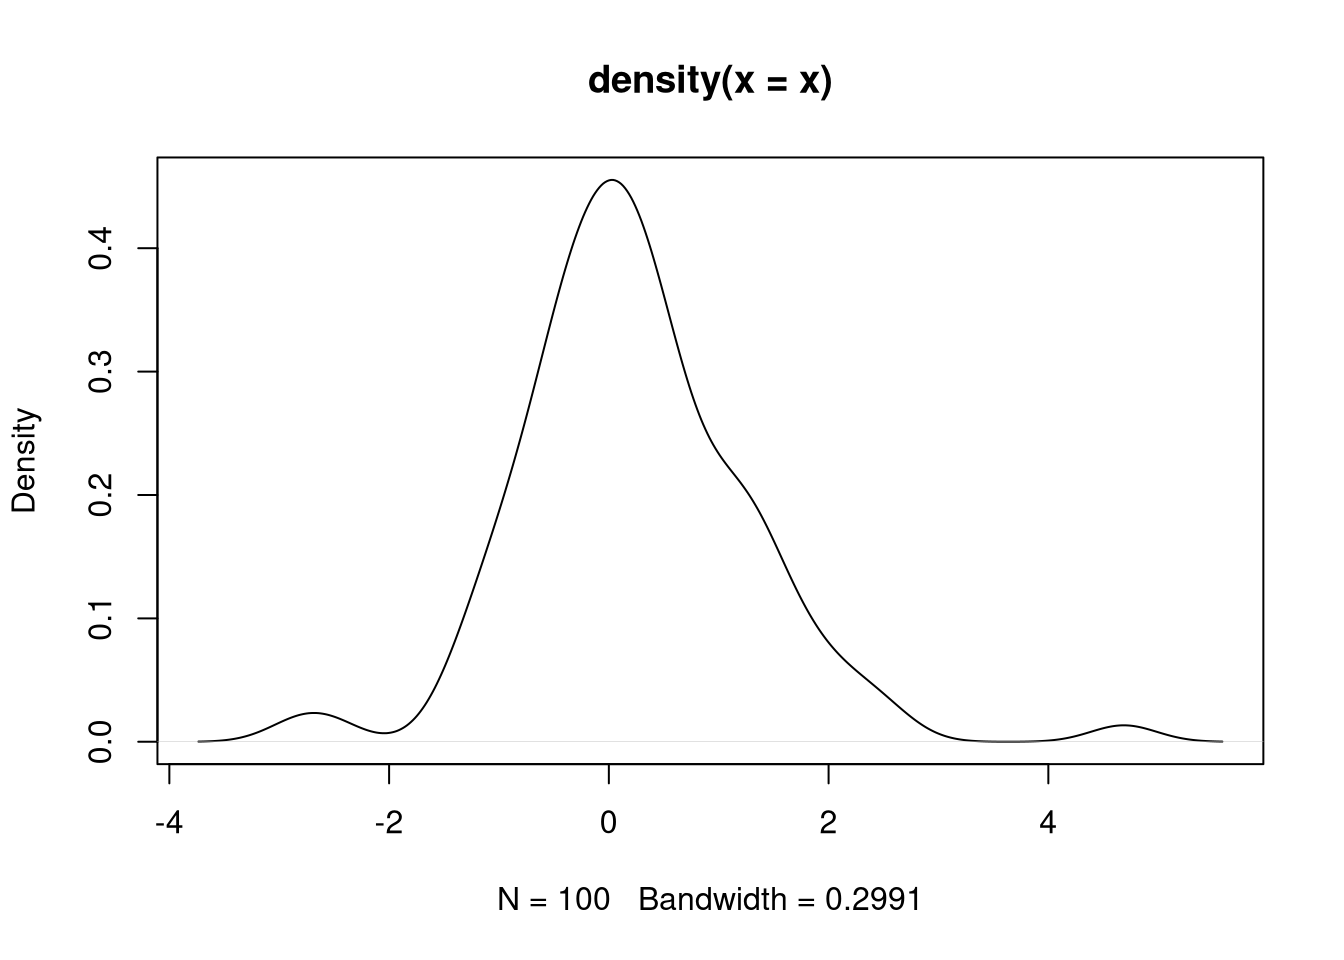
And (b) another involves using ggplot2:
library(ggplot2)

x <- rnorm(100)

df <- data.frame(x)

ggplot(df, aes(x)) +
  geom_density()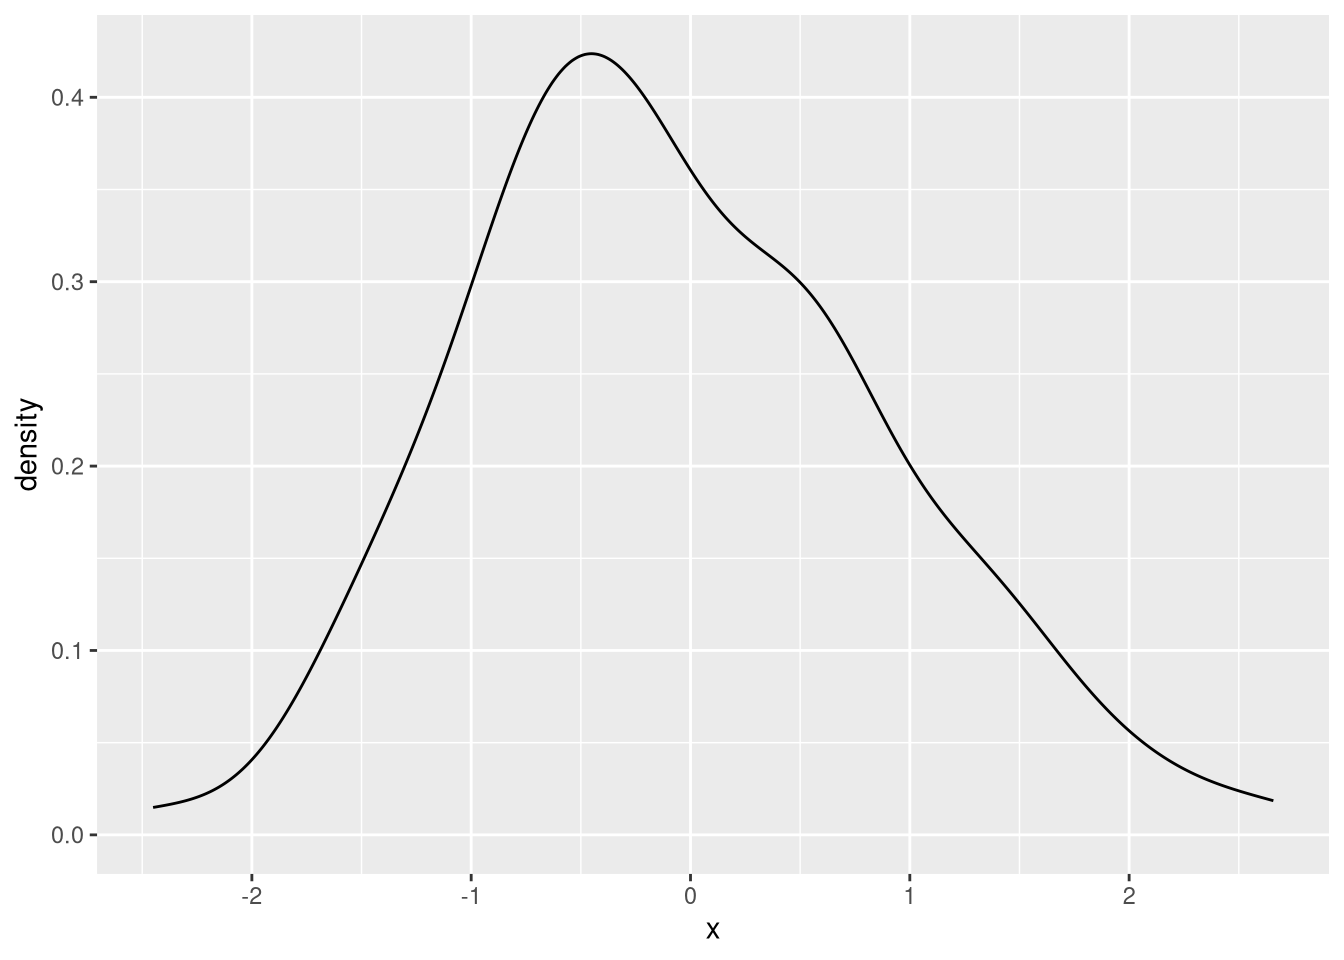
The first option is ugly, and unlike using the hist function to create a
histogram, it requires a small extra step in computing the density before
plotting it. The second option involves way too much technical debt for beginner
R users, especially in a class focused on quantitative methods in geography
rather than on R itself. While ggplot2’s grammar of graphics is powerful and
translatable to many other visualization types, I simply don’t have time to
explain to students why a vector must first be converted to a data frame, how
the aes function works, et cetera, et cetera, and so forth. Further, to create
a minimally nice looking density plot, I think the ggplot example above needs
some color and transparency:
library(ggplot2)

x <- rnorm(100)

df <- data.frame(x)

ggplot(df, aes(x)) +
  geom_density(fill = "orange", alpha = 0.5)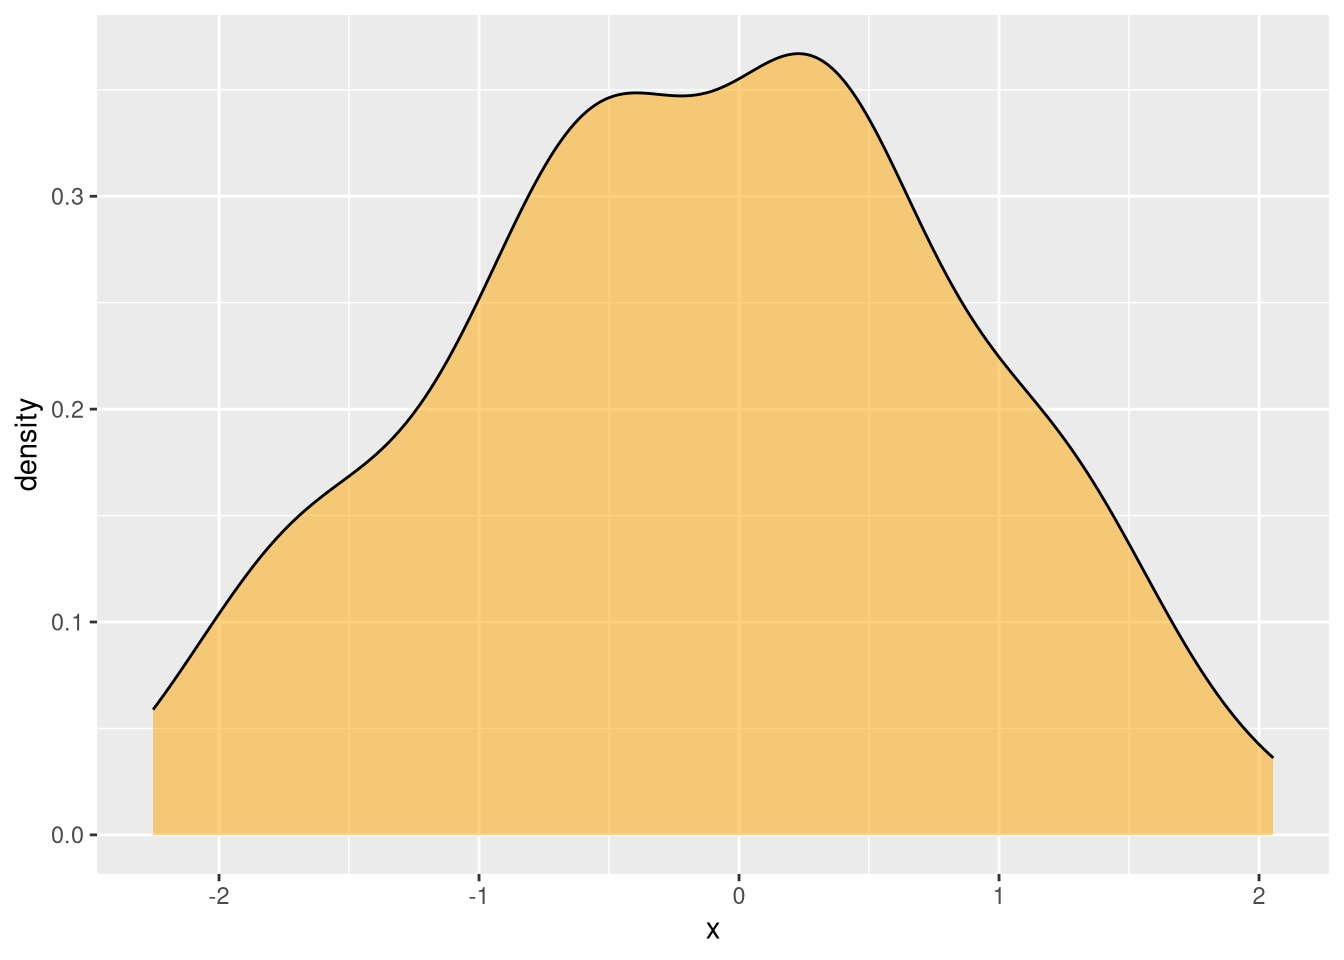
To resolve this issue, I wanted to create a single function option that would
(a) require only one argument, (b) have that required argument be a numeric
vector rather than a data frame, and (c) look nice with reasonable visual
defaults, particularly with color and transparency. So I created a wrapper
around geom_density called pretty_dens (short for “pretty density plot”)
that allows for this:
library(haffutils)

x <- rnorm(1000)

pretty_dens(x)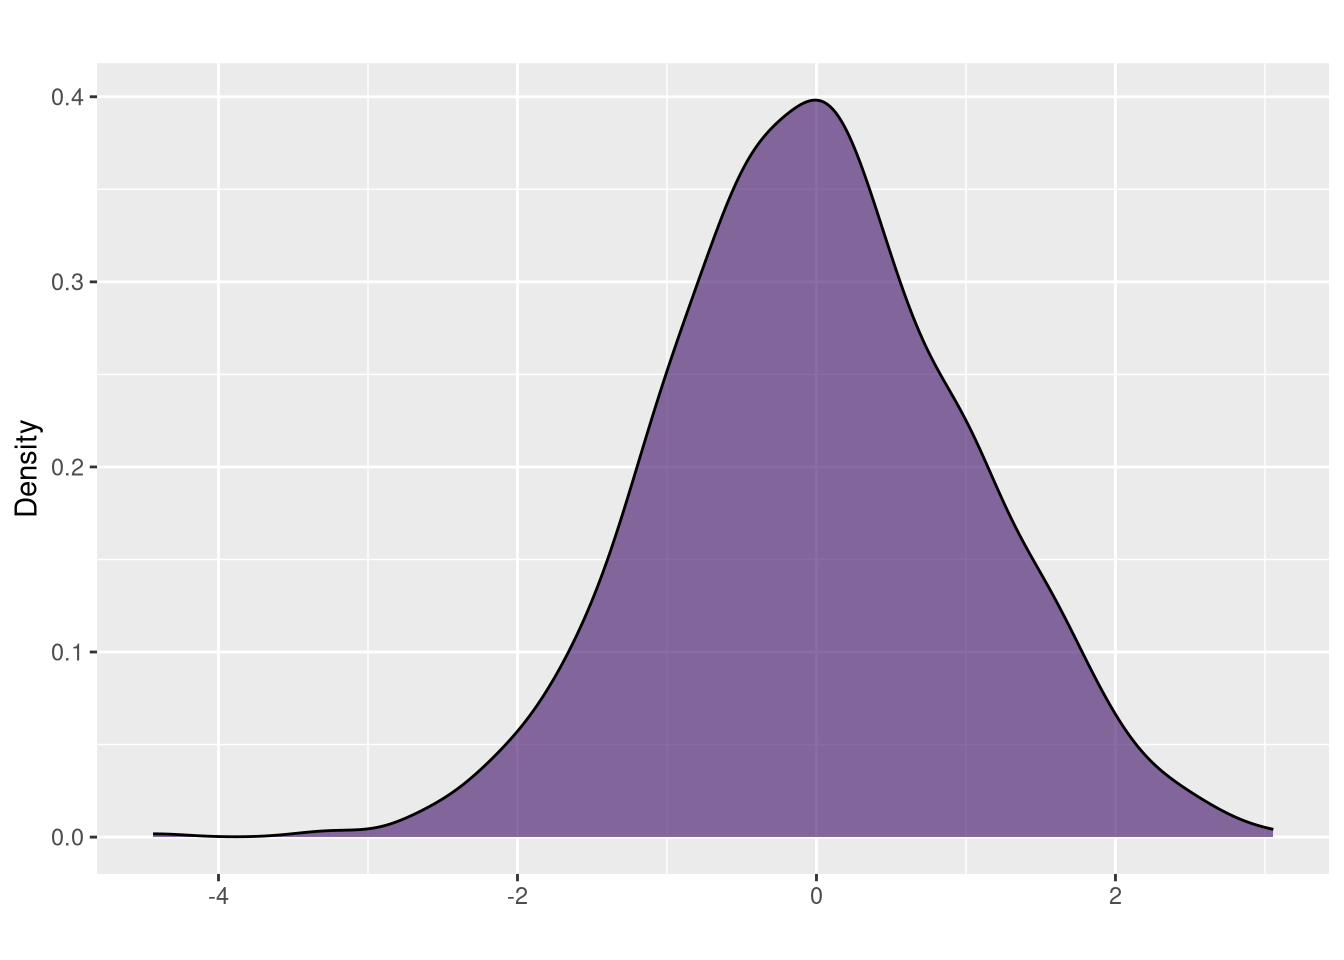
The color is selected randomly from the viridis palette using this in the body
of the pretty_dens function:
fill <- viridis::viridis(100) %>% sample(1)This makes things fun and interesting since it will produce a different color
every time the pretty_dens function is invoked, but written this way, it has a
disadvantage in that it prohibits users from selecting their own color. This is
where the ellipsis come in handy when creating functions, though leveraging its
potential is not intuitive.
Awkwardly, the ellipsis returns some unexpected things when using it in ways
that are commonly used to interact with other R objects, namely typing the
object name in the console to see its contents or by using the class function
to inspect the object’s data type. Consider the example of a relatively basic R
object, the open paren (i.e., ():
> `(`returns
.Primitive("(")And
> class(`(`)returns
[1] "function"But trying these operations with the ellipsis returns something different:
> ...returns
Error: '...' used in an incorrect contextAnd
> `...`Error: '...' used in an incorrect contextAnd
> class(...)Error: '...' used in an incorrect contextThis is because the “dots” (as they are called in the documentation) – and
?... does indeed return its documentation – or the “ellipsis” as it is more
commonly referred to in the R community, is not a function or variable. The
ellipsis is a syntactic element and a reserved word in R.
But the confusion goes even further: suppose you use the ellipsis in function creation to allow for the passing of arguments from your R function to another. E.g.,
#' @usage pretty_dens(x)
#' @param x numeric vector
#' @param ... other arguments passed to geom_density
#' @return a plot
#' @keywords visualization
#' @export
#' @examples
#' pretty_dens(rnorm(1000))

pretty_dens <- function(x, ...) {

  ggplot2::ggplot(df, ggplot2::aes(x=x)) +
    geom_density(...)
  }
Utilization like this:
x <- rchisq(1000, 4)

pretty_dens(x)
Or this:
x <- rchisq(1000, 4)

pretty_dens(x, fill = "cyan")
would work as intended. But if you modify the value of fill in the body of the
function it would obviously override anything the user supplies:
#' @usage pretty_dens(x)
#' @param x numeric vector
#' @param ... other arguments passed to geom_density
#' @return a plot
#' @keywords visualization
#' @export
#' @examples
#' pretty_dens(rnorm(1000))

pretty_dens <- function(x, ...) {
  fill <- viridis::viridis(100) %>% sample(1)

  df <- data.frame(x=x)

  ggplot2::ggplot(df, ggplot2::aes(x=x)) +
    ggplot2::geom_density(fill=fill, ...)
}
In the past, I’ve been confronted with similar situations where I need to check for the existence of certain user arguments and make adjustments if they’re not present. A great example would be the case where a user has not supplied a color for a plot. This example works but it’s unwieldy:
#' @usage pretty_dens(x)
#' @param x numeric vector
#' @param ... other arguments passed to geom_density
#' @return a plot
#' @keywords visualization
#' @export
#' @examples
#' pretty_dens(rnorm(1000))

pretty_dens <- function(x, fill=viridis::viridis(100) %>% sample(1), ...) {
  df <- data.frame(x=x)

  ggplot2::ggplot(df, ggplot2::aes(x=x)) +
    ggplot2::geom_density(fill=fill, ...)
}
This would get out of hand with any more arguments that have their defaults supplied this way. The code used to create the fill should go in the body of the function rather than in its argument list. But this does not work:
#' @usage pretty_dens(x)
#' @param x numeric vector
#' @param ... other arguments passed to geom_density
#' @return a plot
#' @keywords visualization
#' @export
#' @examples
#' pretty_dens(rnorm(1000))

pretty_dens <- function(x, ...) {
  if (!exists("fill")) {
    fill <- viridis::viridis(100) %>% sample(1)
  }

  df <- data.frame(x=x)

  ggplot2::ggplot(df, ggplot2::aes(x=x)) +
    ggplot2::geom_density(...)
}
Since !exists("fill") will always return TRUE in this case, even if the user
supplies a value for fill. The hasArg() function can be used instead to
check for user arguments, even those included in the ellipsis.
#' @usage pretty_dens(x)
#' @param x numeric vector
#' @param ... other arguments passed to geom_density
#' @return a plot
#' @keywords visualization
#' @export
#' @examples
#' pretty_dens(rnorm(1000))

pretty_dens <- function(x, ...) {
  if (!hasArg("fill")) {
    fill <- viridis::viridis(100) %>% sample(1)
  }

  df <- data.frame(x=x)

  ggplot2::ggplot(df, ggplot2::aes(x=x)) +
    ggplot2::geom_density(fill=fill, ...)
}
This works fine if the user does not pass an argument for fill; in this case,
!hasArg("fill") is TRUE, and fill is assigned to a variable. But what if
the user does supply an argument to fill? An error is returned:
object 'fill' not found
If you’ve made it this far, you can probably see that fill is “hiding” in the
ellipsis – R can tell that it has been passed as an argument through
!hasArg("fill"), but because it’s not a required argument, it’s value is
encapsulated in ..., not in the variable fill that is being supplied to
geom_density. Fortunately, we can look for ellipsis variables by using this:
list(...)If this is used in the console outside of a function, it will throw an error as
demonstrated earlier, but inside the function, it can be used to retrieve
ellipsis arguments. As one might expect, list(...) conveniently works when
debugging. So, if a breakpoint is set in a function like this (using Emacs/ESS
and how it visually shows breakpoints):
pretty_dens <- function(x, ...) {
  df <- data.frame(x=x)
B>
  ggplot2::ggplot(df, ggplot2::aes(x=x)) +
    ggplot2::geom_density(...)
We can inspect user arguments once the function is used. With arguments supplied as:
pretty_dens(rnorm(100), fill="orange")From the debugger on the console we can use list(...) which will return:
$fill
[1] "orange"
This feels like that moment in Ocarina of Time when you obtain the Lens of Truth.

ess-bp-set and then C-c C-c and then list(...)The trick then becomes modifying the arguments if they are not supplied in a
way that allows you to avoid explicitly referencing an object like fill as a
standalone variable. So, the recommended way to do this is to put every
user-supplied ellipsis argument in a variable:
args <- list(...)Then, search the variable args for the existence of those arguments you want
to modify, then modify args (which is a list) accordingly. Then, the trick is
to use do.call() to apply each argument from args to the appropriate
function. In my case, it would look like this:
pretty_dens <- function(x, ...) {
  args <- list(...)

  if (!"fill" %in% names(args)) {
    args$fill <- viridis::viridis(100) %>% sample(1)
  }

  dens <- do.call(ggplot2::geom_density, args)
Then, the density plot, dens, is added to the “chain” of ggplot2 functions:
  df <- data.frame(x=x)

  ggplot2::ggplot(df, ggplot2::aes(x=x)) +
    dens
}
And it works! This allows the user to specify their own argument for fill that
gets passed to geom_density, while supplying a reasonable default if they do
not supply one. The whole function has a bit more to it and looks like this:
#' Create a simple, nice looking density plot using a vector as input
#'
#' Base R does not have a one line/one function option for creating density
#' plots. Similar to pretty_hist(), this function takes a vector as input and
#' produces a nice looking density plot of a single variable using ggplot2 under
#' the hood.
#' @usage pretty_dens(x)
#' @param x numeric vector
#' @param title character string, optional title
#' @param xlab character string, optional x-axis label
#' @param ylab character string, optional y-axis label
#' @param ... other arguments passed to geom_density
#' @return a plot
#' @keywords visualization
#' @export
#' @examples
#' pretty_dens(rnorm(1000))
#'
pretty_dens <- function(x, title="", xlab="", ylab="Density", ...) {
  ## get ellipsis arguments
  args <- list(...)

  ## set some reasonable defaults for geom_histogram (ellipsis arguments)
  if (!"fill" %in% names(args)) {
    args$fill <- viridis::viridis(100) %>% sample(1)
  }

  if (!"alpha" %in% names(args)) {
    args$alpha <- 0.65
  }

  dens <- do.call(ggplot2::geom_density, args)

  ## remove na values
  x <- x[!is.na(x)]

  ## create data frame for ggplot2
  df <- data.frame(x=x)

  ggplot2::ggplot(df, ggplot2::aes(x=x)) +
    dens +
    ggplot2::ggtitle(title) +
    ggplot2::xlab(xlab) +
    ggplot2::ylab(ylab)
}
In addition to supplying a default for fill, I also set the opacity to 65%
with the alpha argument. The function also removes NA values. While this is
a bit dangerous for sophisticated users, this function is intended to be used
for teaching purposes, not in a production environment. I also have a
pretty_hist function that creates histograms, and it has some other
considerations that don’t apply to density plots (e.g., number of bins). I may
add to these functions over time and/or create new functions that leverage
list(...) as needs arise.
Aside from its utility, extracting objects from list(...) is fun and gives
me an excuse to do some debugging. With this knowledge of the ellipsis in mind,
you should now put aside [your fear of the ellipsis]. Become who you were born
to be [as an R function creator].