The landscape of geospatial software is ever-changing. There’s no shortage of powerful programs, and due to the wide array of potential employment opportunities for geographers, it would be nice to give students broad exposure to as many as possible. These include ArcGIS Pro, ArcGIS Collector, Survey123, QGIS, PostGIS, Python, R, Leaflet, OpenLayers, Mapbox, and Carto to name a few. The reality is however, that at a four year university we simply don’t have time to teach on everything; we have to make decisions. Otherwise educators can only go “an inch deep and a mile wide,” and students have significant exposure to software but will lack depth in many principal concepts. One increasingly important concept is that of scripting, i.e., using a programming language to automate a task, extend an existing method, or create a reproducible workflow.
Over the past three years, I’ve incorporated scripting in four different geospatial courses: GIS 1, GIS 2, GIS 3, and Quantitative Methods for Geography, namely with Python and R. Having the background of teaching multiple languages in several different courses gives me considerable experience to draw upon, though I should point out that I’ve always used one or the other over a semester; I never mix the two in the same course. Every semester incurs unique challenges, regardless of the subject content or language used. This piece, however, is about the challenges of teaching with Python specifically, not with teaching scripting altogether.
Within spatial analysis and data analysis writ large, there is often a debate about whether it is better to learn Python or R. On this topic, I agree with Matt Dancho’s assertion: “The 2 most popular data science languages - Python and R - are often pitted as rivals. This couldn’t be further from the truth. Data scientists that learn to use the strengths of both languages are valuable because they have NO LIMITS” (emphasis theirs). 1 Here, I wholeheartedly agree. Though I personally use R more in research, I still use Python regularly, and knowing both has been immensely valuable. When students ask me which they should learn, I recommend both. If they only have time to learn one of the two, I recommend Python since it’s more commonly used.
I’m writing this post for two main reasons. First, I want to describe the problems I’ve encountered in teaching with Python as I am genuinely interested in their solutions. It’s a powerful language that is valuable for students to know. There are plenty of others more skilled than me both in using Python and in teaching with it, so if there are solutions to the challenges I describe below, I want to know about them! That said, I believe at least a few of problems below do not have clean solutions, and I think it’s worth elucidating those. Here, I concur with Yihui Xie in his assessment of Joel Grus’ critique of Jupyter Notebooks: ‘criticizing a popular tool is not “an unhelpful way to spend time.”’ 2.
Second, I want to suggest an alternative approach which includes R for spatial analysis without excluding Python. I do this by comparing Python’s challenging facets to how they would be tackled with R, though R has problems of its own. This post has some overlap with the main points brought out by Holger K. von Jouanne-Diedrich 3, but I have several unique points, and I extend some of the common distinctions of the two languages particularly to cases involving spatial data. Further, von Jouanne-Diedrich goes full bore and campaigns for R over Python entirely; his points are not just geared toward the classroom. I don’t go this far as I think individual organization needs are too varied to simply pick one language over the other, so my summary here applies only to a pedagogical context.
My points also apply specifically to geography students and those who are new to
programming languages. While some content may be relevant to other disciplines
or to intermediate students, my focus is notably niche. When I include code
examples, I use Python’s geopandas, shapely, and fiona, as arcpy has
unique workflow shortcomings – ones that are resolved in other libraries within
the same language – so much so that I believe it would make for an unfair
comparison with R. The reasons for using Python libraries other than arcpy is
a topic for another discussion entirely.
The post is organized into three main sections. In the first section, I delve into the drawbacks of using Python for teaching spatial analysis using examples where appropriate. Many of these points bleed together, and Point 1 is pervasive throughout the piece. In the second section, I discuss some shortcomings of R and take on its primary criticism: that employers appear to want Python. In the third section I provide some concluding thoughts and discuss how Python could make me a believer. Hopefully this post serves to promote constructive discussion.
Challenges of teaching spatial analysis with Python
1. Data analysis vs. software engineering
Yihui Xie states this: “I feel a major difference between the R culture and Python culture is that Python users seem to create code more often, whereas R users often use code. There seems to be a strong atmosphere of software engineering in the Python world: in the beginning was the custom class (with methods). For R users, in the beginning was the data.” 4.
The chief task of most academic geographers is analyzing data, not creating software. In essence, I think it’s more prudent to focus on teaching undergraduate geography students scripting – i.e. using code to answer a question, create a map, automate a task, or communicate a concept – rather than creating or customizing underlying software that makes spatial analysis possible.
Certainly Python can be used for data analysis and R can be used for software engineering, but Python lends itself to data analysis less effectively than some other languages. Much of the post will center on this idea. The terms “programming” and “scripting” are often equated, and to many people they mean the same thing. Here however, I make a conscious differentiation. “Scripting” will refer primarily to data analysis whereas “programming” will refer to software engineering.
2. Lack of an expressive toolkit for spatial operations
This is, perhaps, the biggest weakness Python has, and I think it’s an important one. Much of the technical content we teach geography students is about successive spatial operations, and the modus operandi – beyond simply the tool itself – is critical to student comprehension. For example, consider a situation in which one need to complete several operations:
- Read spatial dataset from a web source
- Transform the crs
- Filter points that fulfill a certain condition
- Select columns of interest
- Create a buffer around the points
Compare the two code samples below. The first is written in Python:
import geopandas as gpd

points = gpd.read_file("https://raw.githubusercontent.com/mhaffner/data/master/meuse.geojson")

points_trans = points.to_crs(23032)

points_trans_filt = points_trans[points_trans["lead"] > 150]

points_trans_filt_sel = points_trans_filt[["lead", "cadmium", "elev", "dist"]]

points_buf = points_trans_filt_sel.buffer(100)
This example is not terribly unreadable, but it incurs a cluttered workspace due
to the need to create intermediate variables for every operation. This is not
remotely a performance problem – in fact, the Python example above probably
runs a little faster than the R example below – but it does create a
readability problem. In longer chains of analysis, the number of intermediate
variables becomes unwieldy, and the best practice of creating short but
meaningful variable names becomes impossible. Plus, at the end, I chose to
shorten the variable name to be more manageable: points_buf over
points_trans_filt_sel_buf, but another user inspecting the code may wonder
about this new variable at first glance – is the buffer indeed conducted on the
untransformed data? Or did the naming convention change at some point in the
code?
One could argue that using comments solves the problem of vague code, but I’d
argue that the existence of regular
expressions is enough
to counter that. Maybe one could come up with better variable names or use names
like v1, v2, and v3 instead of the longer examples I’ve used above. Yet
extra short variable names make it much more difficult to spot mistakes, and
they provide less information about the process at hand. Of course, close
inspection of the code could sort any of these issues out, but what if such
nuisances could be avoided?
Now consider an analogous example written in R:
library(sf)
library(dplyr)

pts_buffer <- st_read("https://raw.githubusercontent.com/mhaffner/data/master/meuse.geojson") %>%
  st_transform(23032) %>%
  filter(lead > 150) %>%
  select(lead, cadmium, elev, dist) %>%
  st_buffer(100)
Here, only one variable is created as the process is “chained” together using
R’s pipe operator: %>%. To be fair it’s an ugly symbol that takes a little
getting used to, but I advise students to read the symbol as “send to” (e.g.,
read the data, send to a coordinate reference system transformation, send to
a filter), and they quickly grasp its meaning. Like R’s assignment operator, the
pipe also looks like an arrow, so in a way these operations appear like a
text-based model that students can visualize.
This operator has not always been a part of R but has proliferated in recent
years due to its close association with the popular tidyverse. Aside from the
pipe, other “tidy” functions are more readable as well:
- Selecting variables of interest using
selectvs.[[ - Subsetting by a certain criteria using
filter(column > value)vs.dataset[dataset.column > value]
Before the tidyverse, R’s subsetting and selection procedures looked a lot
like pandas’; then again, it would be more accurate to phrase this the other
way around considering pandas data structures were essentially created to
mimic a data structure native to R, the data frame.
3. More complex syntax
At a certain level, the choice for Python or R’s syntax is merely a matter of preference. I think DataCamp effectively describes the barrier of entry and development progression for the two languages in this: (1) R is a bit easier to learn for those new to scripting/programming while Python is easier for those with more experience. (2) At the same time, it is more difficult to achieve advanced proficiency with R and easier to get there with Python 5. With undergraduate geography students, the goal is to get them to basic proficiency. While advanced proficiency in a number of languages could be beneficial career-wise, it would either take a serious personal time investment or courses outside of our department to get there.
All this said, basic operations usually require more lines of code in Python than in R. For example, consider a situation where one would want to achieve the following in as few lines as (practically) possible using commonly accepted procedures:
- Read a geojson file from the web
- Create a histogram of one field
- Create a simple map of the data
Compare the two code samples below. Again, the first is written in Python and the second in R.
import geopandas as gpd
import matplotlib.pyplot as plt

meuse = gpd.read_file("https://raw.githubusercontent.com/mhaffner/data/master/meuse.geojson")

plt.hist(meuse['lead'])
plt.show()

meuse.plot()
plt.show()
Versus:
library(sf)

meuse <- st_read("https://raw.githubusercontent.com/mhaffner/data/master/meuse.geojson")

hist(meuse$lead)

plot(meuse$geometry)
The difference in lines between the two examples is 7 vs. 4 which admittedly is not a ton. Over the course of large projects, I honestly don’t know if R code is any more succinct than that of Python – and certainly not 75% more if it is – but it ought to be kept in mind that we’re working with students who have had no exposure to scripting. Keeping examples as simple as possible is nice since at this stage, scripting is more of an effort in pattern recognition rather than knowledge implementation.
The Python example has several elements that may confuse students:
- The use of
asto create an alias forgeopandasandmatplotlib.pyplotin order to reduce the amount of typing: while this is not imperative, most internet examples of these packages (and others) use these aliases. What’s more confusing is that instead ofimport matplotlib.pyplot as plt, another commonly used syntax isfrom matplotlib import pyplot as plt. - The discrepancy between how the modules are imported: one contains a period and the other does not.
- The need to use
plt.show()after callingplt.hist()andmeuse.plot(): to be fair, inside of a Jupyter notebook these lines aren’t needed if the user calls%matplotlib inline, but this is another layer of complexity that requires explanation.
Further, consider another example where a user may want to retrieve all of the full (as opposed to relative) file paths in a directory:
import os

def listdir_fullpath(d):
    return [os.path.join(d, f) for f in os.listdir(d)]

file_names = listdir_fullpath("/home/user/Downloads")
Versus:
file_names <- list.files("/home/user/Downloads", full.names = TRUE)The Python example above does several things:
- Imports the
osmodule - Creates a function for retrieving full file paths using list comprehension, since there is no built-in method for getting the full path
- Uses the newly created function to retrieve the file names
It’s good practice to create functions for code which may be used often, and
list comprehension is a powerful construct, but these concepts warrant
explanation on their own. The R example on the other hand, simply uses the
list.files() function and an argument, full.names = TRUE, to retrieve the
full paths.
With some practice with Python, these minor inconveniences become moot. But with
geography and GIS students, these cases demonstrate how the language becomes a
barrier to learning geospatial concepts. Beyond these simple examples, I could
provide other similar comparisons demonstrating the extra syntacical burden in
Python with the creation of web maps (in folium vs. leaflet), type
conversion (in pandas vs. R’s native data structures), and in building web
applications (in shiny vs. flask).
4. Method vs. function discrepancies
A major challenge for newcomers to Python is determining when to use a function and when to use a method like a property of an object. Essentially, methods are special types of functions but they’re called differently. For example, consider the following code:
import seaborn as sns

# load an example dataset
iris = sns.load_dataset('iris')

# view the first few rows
iris.head()

# get a column mean
iris["sepal_length"].mean()
This excerpt first imports the seaborn module. It then loads the “iris”
datsest. The next line of code utilizes the head() method which retrieves the
first few rows. The following line uses the mean() method. This is simple
enough.
However, if the user came across the statistics module, they would
find that mean() needs to be called in a different way:
from statistics import mean

mean(iris["sepal_length"])
While a student likely wouldn’t feel the need to search online for how to
compute the mean if they are using pandas datafames – they would probably
just try the method – this discrepancy is common as there is no
standardization. R trades this problem for namespace collisions and a degree of
ambiguity in where functions come from, but I think differentiating functions
vs. methods is far worse for students.
5. Configuration challenges
Configuring a Python IDE for classroom instruction is a major challenge for a
few reasons outlined as sub-issues below. Most of these are related to the fact
that students won’t have access to the same C: drive from session-to-session on
our lab computers. These issues create significant systems administration
overhead which to time to resolve. Our university staff work incredibly hard at
getting software to work for us, but it’s a legitimate bottleneck for me to have
to make technical requests – e.g., change the default version of Python used by
Spyder, allow write access for pip, etc. – and these issues can grind
curriculum development to a halt.
Configuring R for instruction is simple. One must simply install R, install RStudio, and allow for package installation in a place where students will have persistent access and suitable permissions. This can be a little tricky on lab computers where students won’t have access to the same C: drive everyday, but one of the default locations where R installs packages is in the students’ OneDrive folder. This works perfectly without any modification. I can supply our systems administrator with a list of packages I would like installed by default which will be consistent across all computers, and students can install packages to their OneDrive individually. Next time, if they log on to a different computer, they will still have access to the system packages but also the packages in their “synced” OneDrive folder.
5a. Multiple Python versions installed on a system
From a research perspective, having multiple Python versions available is a good
thing: some modules work with only with specific Python versions, and having
them available is great, especially for the ease of creating virtual
environments. That said, the system’s default Python is not necessarily the one
I want students using. On our lab computers the default is 2.7, and various IDEs
will use different default versions. ArcMap and ArcGIS Pro install their own
separate versions of Python (2.6 or 2.7 versus 3.x, respectively), and ArcGIS
Pro’s version uses the popular Anaconda distribution. Anaconda uses the conda
package manager which is slower than the standard tool pip and should not used
along with pip as they will conflict with one another. Some experimental
packages I like to use in demonstrations and in-class activities are not
available in the conda forge repository, which precludes their use with
Anaconda.
I’m afraid of modifying the system default version of Python to one I prefer
because of how it might affect ArcMap, ArcGIS Pro, and other programs our
various faculty are using. I wouldn’t dare do this during the semester, and even
if I made this request during the summer or winter break I suspect issues may
not creep up until during the semester. I also suspect system updates may tamper
with or reset configuration settings of pip’s default Python version, default
install location, and various IDE settings, requiring manual changes frequently.
Most of these version issues are mitigated by using virtual environments and
other computing best practices, but covering this information in class would
take away from other important content, not to mention be a deterrent to
enrollment for our classes.
It’s possible to install multiple versions of R on one computer, but this is uncommon and not necessary for most purposes. It’s worth noting as well that even if all of these systems administration issues are mitigated, students have a much more difficult time configuring Python on their own computers as opposed to R. I’ll return to this point later.
5b. Difficulty in installing external packages
Depending on whether Python was installed with Anaconda or not, packages are
installed with conda or pip. Either way, this is completed at the command
line, rather than in a Python shell. The command line is generally intimidating
for students, not to mention programming in general. R packages on the other
hand are installed within R at the R console, and this small difference adds an
extra layer of complexity with Python. Further, installing experimental packages
from GitHub with pip is not as straightforward as R’s devtools either.
There is actually a push button tool inside of ArcGIS Pro that allows for installation of Python packages (used in tandem with running Jupyter inside of ArcGIS Pro), but ArcGIS Pro uses the Anaconda distribution, and as stated previously, some of the packages that I use are not available through conda repositories, so this workflow is a no-go. Either way, as explained in the next point, I feel strongly that students new to programming and scripting should be using an IDE.
One might question the need for students to install external libraries that are
not on the system by default, especially since I can (and do) ask our sys admins
to install many packages up front. Also, most of the students I’m working with
are new to scripting, a point I emphasize a lot in this piece. It’s true that
most beginners won’t do this, but gifted students can and will. I argue that the
inability or extra difficulty in installing external packages severely inhibits
exploration and introduces continuity problems if another IDE/framework is used
for Python instruction in the future. No matter which framework and setup is
used for Python development, students have a much more difficult time
configuring it on their own. I’ve seen students in their first semester of using
R lounging in our hallways and labs using a dark-themed version of RStudio and
installing GitHub packages with devtools on their own laptops. I’ve never
heard of or seen my students at any level of scripting using Python this way,
even those who have taken a dedicated Python course in the Computer Science
Department.
5c. Varied IDE usage
The problem with configuring an IDE (or editor for that matter) is related directly to the previous two points. There is no shortage of Python IDEs in the world, but those that are relatively easy to use out-of-box – namely Spyder, PyCharm, and PyScripter – have given the students and myself major headaches (for various reasons) when attempting to use them for instruction. Much of these issues are related to having multiple Python versions installed on the system and the challenge of installing packages.
At the beginning of my GIS 3 class this semester, I decided to use PyCharm after much painful experimentation with various IDEs and web services. The default version of Python selected by PyCharm is a version of Python 3.8 that comes installed with ArcGIS Pro, likely set as a system variable. So I have students create a project using a different version of Python that will allow them to install packages – also 3.8 but not installed with Anaconda – and create a virtual environment on our department’s network drive so they will have access to it when working from home or on a different lab computer. This only has to be completed once with the push of a button, so I’m able to skirt around the explanation of virtual environments. I would never recommend using a virtual environment across a network drive as a day-to-day workflow, but I thought it would enough to tie us over for the semester.
If this seems overly complicated and fragile, I would have to agree. But this is literally the only combo that I could get to work on our lab computers that would allow students to:
- Use an IDE that allows for single line code execution
- Install packages with
pip - Avoid having to activate virtual environments manually from the command line
After a successful first day of instruction with PyCharm, during the subsequent
class period everyone except me working from the teaching station had errors
associated with the Python interpreter after loading their project. After having
previously scrapped Kaggle kernels, I am back to using it for instruction again,
which is better than nothing but forfeits two of three of the points just
mentioned. For example, I recently discovered a package called geoplotlib and
wanted to potentially demonstrate it in class, but it’s not available on Kaggle
and therefore the students can’t use it. Kaggle says that they’re willing to
consider library additions, but I doubt they’ll add anything that isn’t
extremely stable. Even if they did add it, this is not a suitable long term
workflow.
Sadly, when I first taught GIS 2 as a newly minted assistant professor, I was primarily using Python and PyCharm – it was the first IDE I tested for instruction – but I decided to scrap Python all together in large part due to the difficulties in configuring it and the clear lack in student enthusiasm. Two and half years later, after evaluating as many other options as I feasibly could, I went back to the same workflow that I left due to its complexity, only to scrap it again.
In addition to Kaggle and PyCharm I’ve also physically tested:
- Spyder (which I believe is nearly on par with RStudio but had to nix due to inexplicable errors related to setting the default Python version, along with other shortcomings related to the previous two points)
- repl.it
- CoCalc
- PyScripter
- DataLore
- Google Collab
- Local Jupyter Notebooks
None of these were able to fulfill the three requirements of (1) single line
code execution, (2) ability to install packages with pip, and (3) avoiding
activation of virtual environments from the command line, even if I had even
budged on the IDE requirement. All of these problems are avoided with RStudio.
Within the R community, the vast majority of users rely on RStudio as their IDE of choice. It is widely accepted, painless to install locally, and relatively intuitive to use. I think that the Python community is a bit more fractured on its choice IDE. In fact, the most commonly used platform for Python scripting (i.e. data analysis) is not an IDE at all: it’s the Jupyter notebook. This software is a bit less intuitive for students as it is tied to a background “kernel,” there is no variable explorer, and single lines of code cannot be sequentially executed without being in a cell of their own. I feel strongly that new programmers should be using an IDE due to the availability of these helpful features.
It may appear as though my recommendation, RStudio, is strongly influenced by my own preferences. That’s less true on this point than others in this post. As an Eamcs user I haven’t touched RStudio for my own work in years – not to mention Python-specific IDEs since I use Emacs for Python development as well – but I do think RStudio is a more user-friendly choice for students. Paradoxically, RStudio 1.4 is an excellent Python IDE, so if other issues could be mitigated, it may be a useful, low barrier of entry tool for Python instruction.
6. A general purpose programming language?
One of the main arguments for using Python over other languages is that Python is a “general purpose” programming language. While Python probably has broader applications and usage by industry, for much of the work that students do in the classroom, R has far wider applicability. Much of this has been enabled by the framework “RMarkdown” which allows users to weave markdown and R code together. In fact, it’s so generalized that one can even use it to integrate markdown with Python and render a document with an R process. I’ve done this before with a Python case study and the output looked far better than anything I can produce with Jupyter Notebooks!
Personally, I’m currently using R, RMarkdown, and Shiny to
- Serve out all course materials (syllabuses, assignments, etc.)
- Create class presentations with interactive charts and web maps
- Create web applications for teaching concepts
- Create web applications for spatial data collection
- Maintain my personal website
- Produce literate programming reports
Python modules can accomplish some of these tasks, but the barrier of entry for these in R is so remarkably low that students with no experience with R can accomplish some by the end of a semester.
7. Fewer libraries for accessing spatial data APIs
In all of my geospatial classes, extracting US census TIGER files is a common task. Suppose there is a need to download a road dataset for Eau Claire County. This can be done in cleanly in Python by
- Finding the file path on the census’ FTP server (must be done manually outside of Python)
- Downloading the .zip file
- Extracting the .zip file
- Reading the resulting shapefile with
geopandas - Cleaning up intermediate files created in the process
import wget
import zipfile
import geopandas as gpd
import os
import glob

# download roads
url = "https://www2.census.gov/geo/tiger/TIGER2019/ROADS/tl_2019_55035_roads.zip"

urllib.request.urlretrieve(url, "tl_2019_55035_roads.zip")

# unzip them
with zipfile.ZipFile("tl_2019_55035_roads.zip") as zip_ref:
    zip_ref.extractall()

# read roads as a geodataframe
roads = gpd.read_file("tl_2019_55035_roads.shp")

# remove intermediate files
for f in glob.glob("tl_2019_55035_roads*"):
    os.remove(f)
I typically followed a very similar approach until I discovered R’s tigris
package:
library(tigris)

ec.roads <- roads("WI", "Eau Claire")
Much of the tedious work displayed in the Python example is done behind the
scenes with R’s tigris. Unlike the previous code comparisons, this discrepancy
is not inherent to language itself. Someone could come along and implement the
tigris of Python; nothing about the language prevents it. It’s simply an issue
of what is currently available. I could probably implement this in Python if I
had the time and motivation.
But aside from tigris, at least two other R packages do not have a Python
equivalent and require far more manual labor if R is avoided: tidycensus,
which is used for retrieving US census data (along with its spatial data
counterpart) and osmdata, which is used for extracting spatial data from
OpenStreetMap using the Overpass API. There are probably others.
8. Lacking geo-visualization capabilities
Both Python and R have a wealth of visualization libraries. Python has
matplotlib, seaborn, and pygal, and R has ggplot2, among others. When it
comes to static visualizations, some of the choice in toolset is simply a matter
of personal preference, but I think it’s generally accepted that R produces more
aesthetically pleasing non-spatial visualizations (see DataCamp’s comparison of
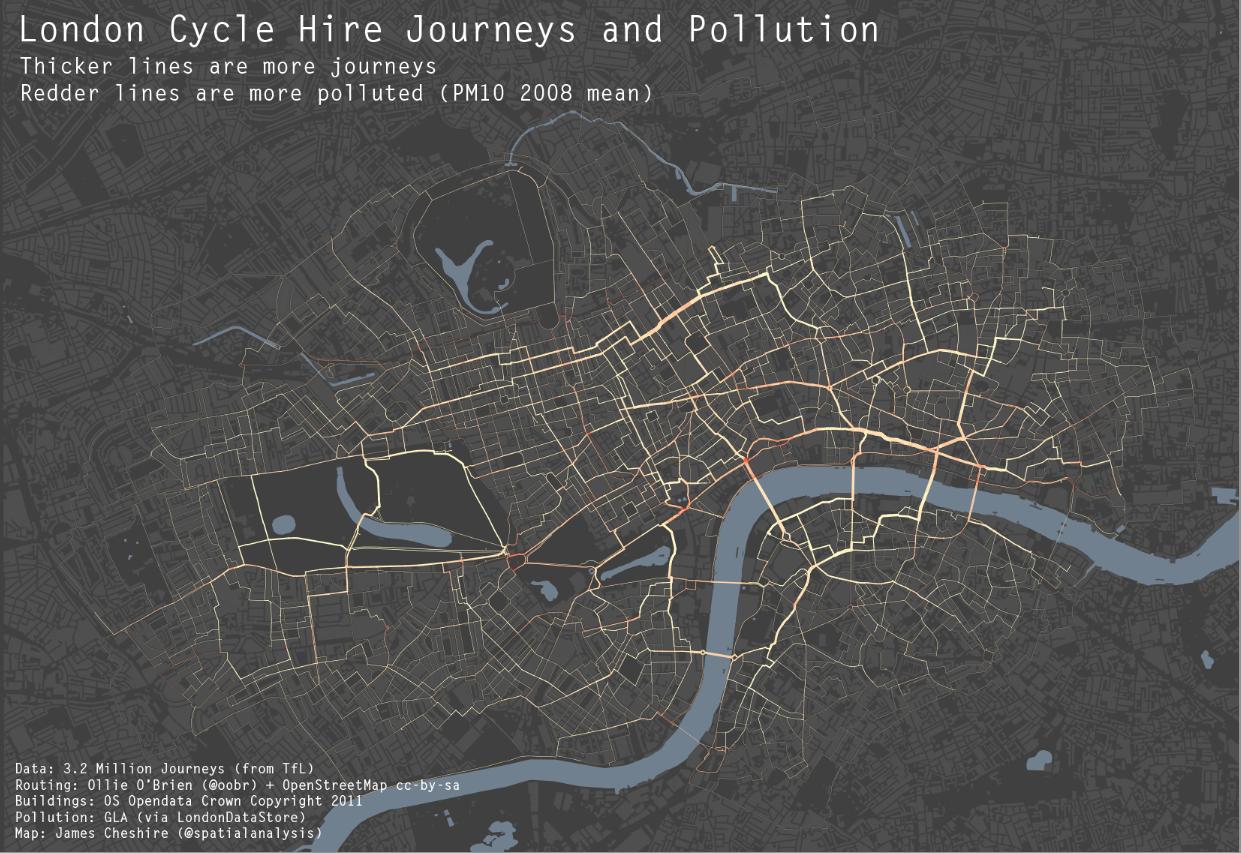
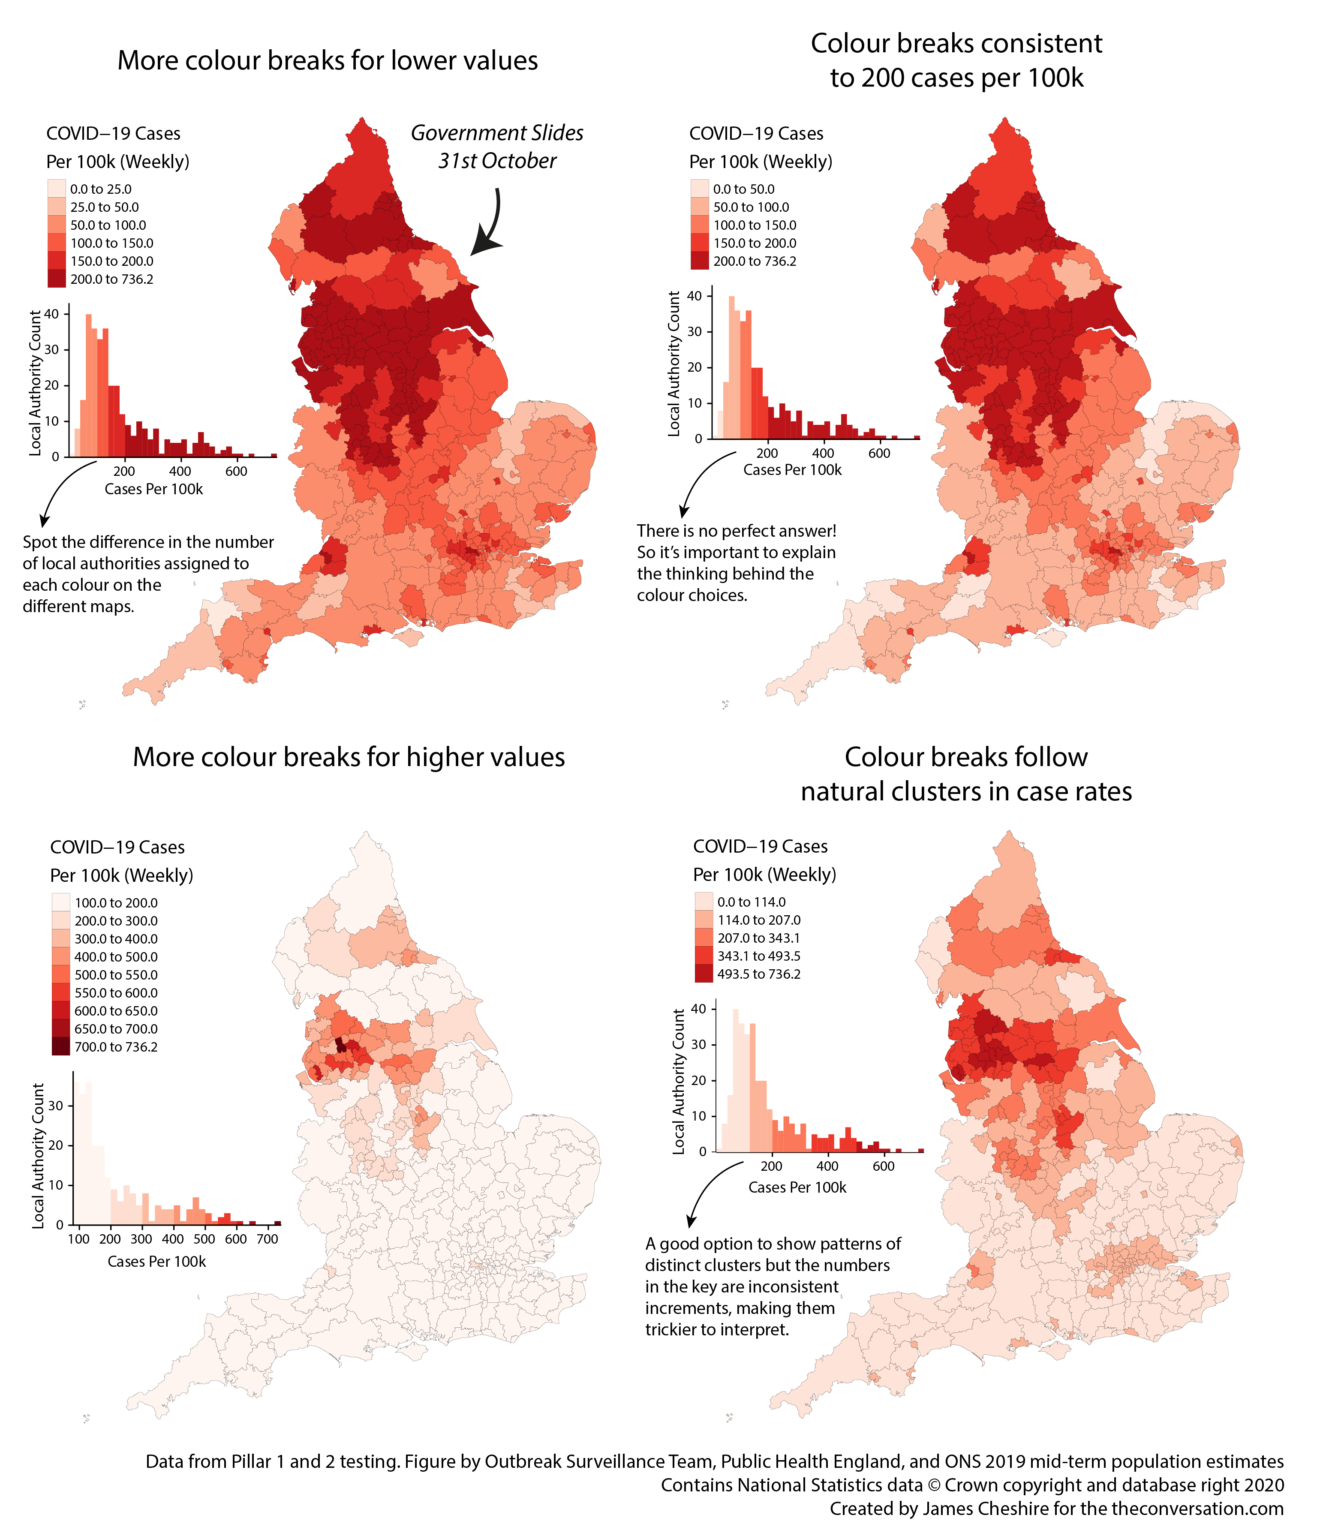
R and Python 6). When it comes to mapping, I think there’s much less debate.
I’ve seen ugly maps made in Python, and I’ve seem plenty of ugly maps made in R,
many of them made by me. I’ve never seen a beautiful map made in Python, but I
have seen some made in R, occasionally with surprisingly simple syntax.
Several examples come to mind:

There are also several packages for creating maps in R, each with different strengths:
ggplot2: a general purpose plotting library which makes syntax consistent with that of non-spatial visualizationscartography: good for vector data, choropleth maps, and proportional symbol mapstmap: becoming the new standard for visualizations in R, this package contains many wrappers around other popular spatial data packages to making mapping more user friendly
9. Community disconnect
This is a minor and somewhat subjective point but one worth mentioning. When our students encounter other people “in the wild” – searching for help on the internet, going to conferences, attending technical workshops for a general audience – they are far less likely to encounter other Python users “like them” as opposed to R users. As mentioned at the beginning of this piece, Python has a stronger culture of software engineering while R has stronger culture of data analysis. Most users of R are domain scientists who use scripting as a means to an end, rather than software engineers who view code as the end. Of course, plenty of people use Python for scientific computing, but the proportion of people who do so is much smaller.
It’s also worth noting that many companies develop Python code and contribute to open source projects, but none is as contributory to the language as RStudio is for R. RStudio, a public benefit corporation which makes the popular IDE by the same name, has a vested interest in creating easy-to-use software domain scientists who are not computer scientists by trade. The company even has a branch dedicated to creating educational resources for R. It’s not that other organizations don’t have educational branches; it’s simply that few languages have an organization dedicated to creating material for students just like ours, and the bulk of educational content RStudio produces is geared toward R more generally, rather than their specific products.
10. Students don’t get it
From my experience in teaching with many software programs in a variety of different geospatial courses, students simply don’t understand Python well, even those who have taken a 3-hour Python specific course in the Computer Science department. Beyond this, they don’t enjoy Python much either. The influence of my expertise on the level of student engagement can’t be ruled out, but I believe the challenges associated with Python described throughout this piece play a greater role. When teaching with Python, I spend more time talking about idiosyncrasies of the language and less time teaching on spatial analysis. I don’t mind teaching about programming languages, but I care about spatial content much more. I don’t think these problems justify eliminating scripting from a geospatial curriculum altogether. Rather, either the solutions to the Python problems ought to be rectified or another language/framework should play a greater role in the curriculum.
Shortcomings of R
R is certainly not a perfect language or educational tool, and there are legitimate drawbacks that are worth weighing. I outline several in this section. The first issue is the one most commonly referenced, and I tackle it in depth, largely because I feel it is less important than people make it out to be. The issues with R that follow are more minor, but admittedly some do not have clear resolutions.
1. Employers generally want Python
It’s true that entry level job ads mention Python more commonly than any other language; I’m more than willing to concede that. However, I don’t accept the premise that the role of a university education is to train students for jobs, and even if it was, I certainly don’t think the target should be entry level positions. On the other hand, there is a reality that students might view their education that way, and they expect their education will be relevant for the workplace. Further, part of what drives students in selecting a major is their prospect of employment after graduation. I can understand from an employer’s perspective that, all things being equal, they would rather hire someone who is familiar with their toolset rather than another ecosystem. Python appears to be the scripting language of choice, but I question how often entry-level employees use scripting in their day-to-day work.
I’d also question why from a technical perspective employers would prefer Python experience over R beside the fact that Python has a reputation of being more tightly integrated with ArcGIS. This is in fact true, but from all of my conversations with potential employers and with students who are in the work force, I have yet to hear of a use case in which Python was unquestionably the right choice as opposed to another language. Again, I think there are many cases where Python is the right choice! But I would speculate that employers prefer Python because of legacy and perceived needs rather than specific use cases, just like the data science job ads I see that reference things like “spacial” analysis and “geospatial informatics system”: they have a general idea of what they are looking for but don’t understand the depth of the topic enough to know how that requirement fits directly into the position. Maybe I’m not giving employers enough credit, but on more than one occasion I’ve heard employers adamantly lobby for Python and then admit to having little to no programming experience themselves. I’d wager that what employers really want is exposure the language (Python) and scripting experience more generally.
In essence, I honestly believe the vast majority of students who use Python in my classes as opposed to a language like R will be less equipped for workplace success – especially in the long-term – because of the reasons described in the previous sections. They will have a lower ceiling for their specialized field of interest because they will have spent more time learning a language up-front and less time mastering higher level spatial concepts through the language. They’ll be more equipped for software engineering and less equipped for spatial data analysis. I don’t think that’s a wise tradeoff. I can’t be convinced that a student highly skilled in R with no exposure to Python is ill-equipped for the modern workplace, even though I’d advocate for exposure to both languages even if employers’ desires were not a factor. The challenge is convincing employers that students are well-equipped for their organization even if they’ve spent more time in tools not listed explicitly on a job advertisement. For this reason, I think exposure to Python is crucially important, particularly in lower level courses like GIS 1 or Intro. to GIS– at least enough for students to feel confident putting it on their resumes.
Satisfying the employer requirement of Python experience could easily be done in
a four week segment of a GIS 1 course or in a standalone one hour course. Would
this simply a “box checking” exercise? Perhaps, but at present, we introduce
Python in GIS 1, and I teach with it in GIS 2 and GIS 3, and due to the
challenges described here I feel it is little more than a box checking exercise
currently. I’ve heard of geospatial educators at other institutions weighing
whether or not to teach arcpy, with the only real upside that it satisfies
what employers claim they want. I think there is a place for “teaching to the
job” and that this needs to be done to some extent, but teaching with subpar
workflows over the course of multiple semesters to satisfy an entry level job
requirement is a high price to pay.
Beyond all this, I think the employer desire for Python is largely an artifact of the jobs available based on how the academy approaches GIS – the choice to emphasize database management vs. geostatistics, for instance – rather than a necessity of employment with a geospatial skillset in itself. If this is the primary drawback to R, I don’t think it should be a serious deterrent to its use for geospatial education. Python and R can be taught the same curriculum, and students can be at least just as competitive for entry level jobs with a curriculum that includes Python but focuses more on R as they can with a curriculum centered exclusively around Python.
2. Namespace collisions and functions that appear “out of nowhere”
This is, no doubt, a legitimate concern in R: a user loads several packages and uses their functions:
library(sf)
library(tigris)

wi.places <- places("WI")

plot(wi.places$geometry)
But where did each of these functions come from? Did places come from sf,
tigris, or one of the base R packages loaded by default? A user can always
find this out through various techniques, and experienced users will simply know
out of…well, experience, but it’s not made explicit in the code. Even more
confusing is the fact that plot is a function that is part of base R, and it
will allow you to use the function but it won’t work properly with spatial
objects (e.g., sf) unless sf is loaded first. There is a subtle difference
between “loading” and “attaching” a package that is not intuitive for beginners.
The real killer is a situation where a base R function, like filter, is used
without loading the intended package, e.g., dplyr:
#library(dplyr)

filter(mtcars, mpg > 20)
This will throw an error message but not one that is expected. A user can
specify the package explicitly, e.g., dplyr::filter rather than filter, but
this is not used commonly in example scripts. The double colon :: should
always be used if there is any question about two packages sharing the same
function name, but in practice – and in examples students will find online –
it’s often omitted.
Python has far less ambiguity with namespace issues. There are fewer “base”
functions that are called frequently, and the user typically references the
module name (or alias) explicitly within the code. In my experience, I used to
commonly see from module import *, making all functions of a module available
implicitly, but this is far less common now.
3. Use of a period in variable and function names
This is the number one complaint I hear from those learning R if they have
experience in another language. The period, “.”, is an acceptable and commonly
used character in both variable and function names. For those with prior
experience in Python, JavaScript, and other languages, this takes some getting
used to. Like many other problems, this is a non-issue for those encountering
scripting for the first time.
4. Lack of a unified model interface for spatial analysis
I envy Python’s scikit-learn on this point. For problems like interpolation
and clustering, sklearn has a consistent syntax for implementing functions and
data structures for output. These translate directly to more general machine
learning problems. While R has caret for machine learning, it has a smattering
of different object types and data structures for various spatial analysis
operations outside of the formal Simple Features standard. I believe this will
improve over time with the adoption and proliferation of sf, but this problem
can be frustrating for novices and experienced users alike.
5. Need for production grade machine learning code
This is a non-issue for new programmers/scripters, but if a geospatial department wanted to gear its curriculum toward production grade machine learning, Python would clearly be the right choice.
Conclusion and how Python could make me a believer
When I started writing this post, I expected it to be 1500 - 2000 words rather than pushing 8000. I suppose this is the culmination of three years of being immersed in geospatial education as a person who uses scripting for all spatial analysis research and views it as crucial tool for students. For the record, I love using both Python and R and will continue using both in research no matter how my courses are taught. I simply believe in using the right tool for the job. Though I’m open to other approaches, at this point it should be clear that I believe R is the tool currently most suitable for teaching geospatial concepts. It might not always be that way. In fact, a feasible scenario of the future is one in which Julia becomes more prevalent scripting language for data analysis and geospatial education.
All this said, there is hope for Python to make me a believer, and I would less begrudgingly use it in the classroom if several problems were effectively addressed. Namely, if:
- Students took a general, introductory Python scripting course concurrently with or as a prerequisite to upper level geospatial courses, even if it was just one credit
- A better IDE emerged (RStudio 1.4 shows promise here)
- A solution to the configuration challenges was sorted out, including package installation (I would suspect )
- Python developed a
tidyverseequivalent - Python spatial data APIs caught up to those of R
It would not even be necessary for all of these be fully solved, just several. A
tidyverse equivalent alone is a tall order, for instance, and in recognition
of that I’d be willing to use Python without it.
I would love to hear feedback about how these issues could be addressed or other strategies for teaching scripting in a geospatial curriculum. Please reach out if you have any suggestions. I would be delighted to keep the conversation going.
Footnotes
https://www.business-science.io/learn-r/2020/04/20/setup-python-in-r-with-rmarkdown.html↩︎
https://yihui.org/en/2018/09/notebook-war/#the-two-cultures-the-r-vs-python-culture-or-data-analysis-vs-software-engineering-culture↩︎
https://blog.ephorie.de/why-r-for-data-science-and-not-python↩︎
https://yihui.org/en/2018/09/notebook-war/#the-two-cultures-the-r-vs-python-culture-or-data-analysis-vs-software-engineering-culture↩︎
https://www.business-science.io/learn-r/2020/04/20/setup-python-in-r-with-rmarkdown.html↩︎
https://www.datacamp.com/community/tutorials/r-or-python-for-data-analysis↩︎
https://spatialanalysis.co.uk/2012/02/london-cycle-hire-pollution/↩︎
https://spatialanalysis.co.uk/2012/02/london-cycle-hire-pollution/↩︎