Introduction
“Some people actually like writing programs for things that can be done with the push of a button,” said the local GIS conference presenter. A student of mine, also in attendance, pointed at me and exclaimed, “Poster child!” We both had a good laugh, but situations like this remind me of the gulf between perspectives for GIS work.
For some, the necessity of using scripting for spatial analysis is obvious, while others can’t see its utility despite sincere attempts. While using point-and-click software and scripting both have their place for the appropriate task, I feel strongly about which approach should take precedence for geospatial work, as given away by the first paragraph. This piece will explain why I feel that way. While this is directed particularly toward to my students, others will surely benefit from the content as well.
First, however, some definitions are in order. Here, “point-and-click GIS programs” refer to software like QGIS, Global Mapper, ArcMap, and ArcGIS Pro - programs where the dominant modus operadi is clicking buttons on a graphical user interface (GUI) to execute functions. Point-and-click programs are “mouse heavy” and require extensive clicking. This differs from “scripting” which is primarily keyboard-driven and involves writing code to execute functions. Languages such as Python and R are commonly used for scripting in GIS. I intentionally use the term “scripting” as opposed to “programming”, as the focus of this piece is on data analysis rather than software engineering.
I’m going to break the rules of good writing on this one by not stating up front the reasons for why I believe scripting is a superior approach. Rather, I’m going to bring you through my personal story, provide some reflection on the significance to the larger GIS industry, and then go back and summarize these points. It’s been a multi-year odyssey, and the fact that I’m taken aback by sentiments like those in the first sentence remind me that others haven’t had my unique experiences. The chain of events that has led me to my current stance has been boiled down into small declarations which make perfect sense to me – and are shared widely by many in the field – but I rarely detail these experiences with others, including my students, mostly because it would take too long (look at how long this post (and sentence) is/are!). If you have a difficult time seeing the value of scripting, I sincerely invite you to keep reading. It took me a long time to change my approach, even after I had changed my mind, so I can sympathize with those who have reservations.
My journey
The need for 80 million calculations
I was first introduced to scripting in a GIS Programming course as a first
year master’s student. While I gained some valuable introductory experience to
Python, using arcpy was exceedingly challenging, and I never used the course
content directly in any research1. However, the course showed that it was
possible to automate tasks and that sentiment stuck with me.
A year later I was working on my master’s thesis needing to make about 80 million calculations (drive time predictions) from different combinations of theoretical work, home, and activity locations in two metropolitan areas. I had worked out in my head how this would be done with a script – a loop with 20 iterations – and shared my plan with my master’s advisor. He was less than enthusiastic and suggested instead that I run each iteration separately on computers in a GIS lab.
Early simulations suggested that each iteration would take about 24 hours to run on a single machine using built-in, push-button tools. So he suggested I go to the departmental labs late on a Friday night, sign into 20 computers one at a time (there were two labs with 12 computers each), and on each computer run one iteration. It would take all day (literally), but since it would be the weekend, there wouldn’t be many other students around, and a few computers would still be left open for others to use.
This sounded like a depressing undertaking, but as a lowly master’s student, I said, “OK,” and walked out, unwilling to push back but fully determined to come up with a alternative solution. This process did not seem fault tolerant at all, and I was skeptical that the computations would only have to be completed once. I could tolerate one long night in the computer lab, but I suspected that the analyses might have to be executed again. What if the underlying data changed (e.g., certain observations needed to be added or removed)? Or the road network’s parameters needed modification? Or a subtle mistake was discovered in the model? Any of these situations would require new computations.
I took the next few weeks to write a script which executed the analysis, ran rigorous tests, and it worked. It took about 10 hours to run, but it only required one machine and took little time to setup. I showed my advisor and he was satisfied. Sure enough, I did have to change the road network’s parameters and make some changes to the underlying data; I ended up running the analysis at least ten times and saved myself more than a few painful nights in the lab. Though this was a gratifying experience, it didn’t fundamentally change the way I thought about spatial analysis or the way in which I carried out GIS work. I continued to use ArcMap for the remaining parts of my thesis and for all coursework in the first year of my PhD.
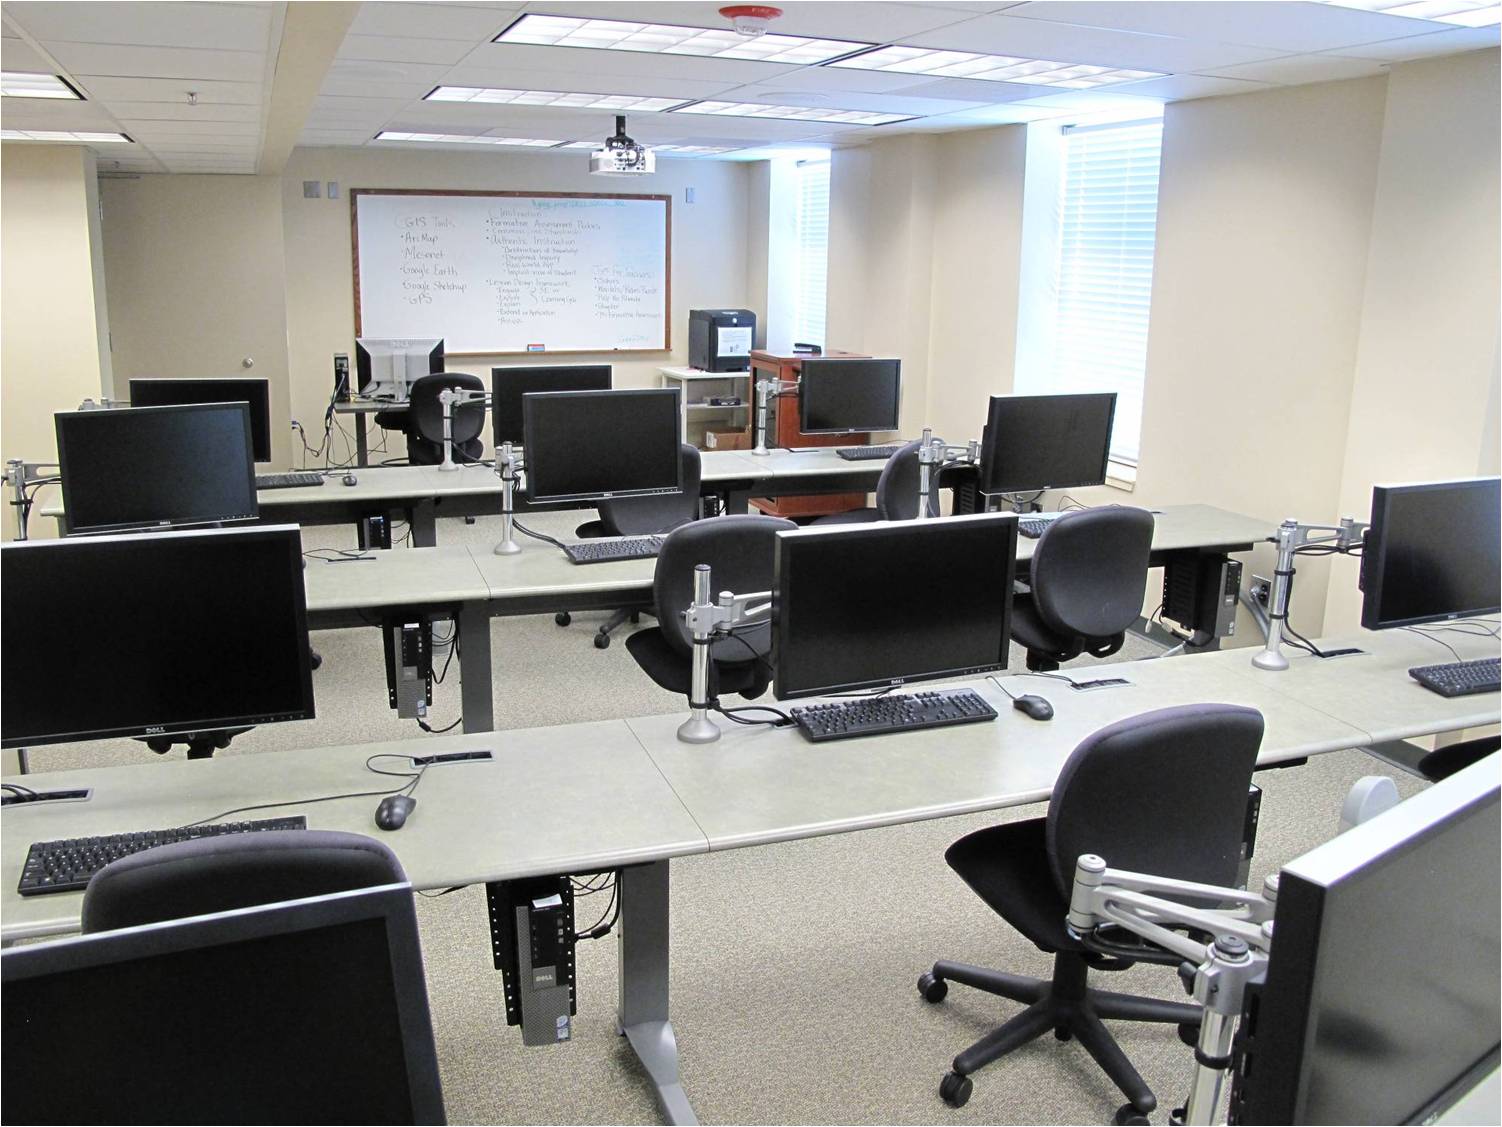
Figure 1: An Oklahoma State GIS lab, one to which I narrowly avoided having to paying rent as a master’s student
Working with a soil physics research group
In the summer of 2015, I was going to be jobless (my teaching assistantship didn’t provide any employment for the summer), and I reached out to a professor I knew in the Department of Plant and Soil Sciences – Dr. Tyson Ochsner – about the possibility of working for him. Thinking I was programming hotshot for my master’s thesis efforts and for completing some experimental Twitter data collection using Python, I was enthusiastic about my potential. His research group was building a soil moisture mapping system, needing to collect data from the Oklahoma Mesonet and predict soil moisture at various depths at unmeasured points. I assumed I could waltz in, write scripts to collect their needed data, show them a thing or two about GIS, use some built-in ArcMap tools for the interpolation, and push the group to new heights.
He benevolently hired me, and in the first couple of days I was in shock. The research group culture was completely unlike anything I had been a part of. It wasn’t intense per se, but their analytical approach completely foreign to me. The scripts I thought I would write were already written – and much more elegantly than I could have – and the problem they were trying to solve was far more complex than I could have imagined. Tyson placed immense value on scripting, reproducibility, and good documentation, and for weeks I had a hard time even grasping why.
In my opening week I found that a post-doctoral researcher in the group, Jason Patton, had been experimenting with PostgreSQL/PostGIS, using Jupyter notebooks for literate programming, and conducting coordinate reference system (CRS) transformations with Proj4 strings. PostGIS? I couldn’t even figure out how to install it. Jupyter notebooks? I could barely start a kernel from the terminal. Proj4 strings? I had memorized the difference between “Project” and “Define Projection” but didn’t know more than that. In all honestly, I was embarrassed by my lack of knowledge, and knew that I would have very little to contribute without a big leap in my skills. Jason – along with others in the group – clearly knew far more than me about spatial data, spatial analysis, and general spatial problem solving despite not having a background in traditional GIS.
My watershed moment occurred about a month into the project. We needed to create an 800m x 800m grid across the entire state to serve as our prediction points. I found a custom ArcGIS toolbox online and figured this would be my opportunity to contribute. I set up a machine to run the tool and checked on it periodically. After 24 hours it wasn’t complete. After 48 hours, the machine was still going strong. That was on a Friday. I left it running over the weekend. When I came back on Monday, it had crashed. A good 100+ hours of runtime and nothing to show for it.
I told Andres Patrignani, a doctoral candidate on the project, about the dilemma. I explained my understanding of how the tool worked, and he thought he could code the solution. Thirty minutes later he asked me to come back to his office; his MATLAB script was complete. The script ran and did exactly what we wanted. Top to bottom it took 7 seconds. At that moment I fully understood why a reproducible approach was paramount and decided to stop relying on point-and-click tools to do the spatial thinking for me.
Even though at this point I was committed to scripted solutions, occasionally I would go back to using ArcMap for a one-off – or what I thought would be a one-off. Tyson wasn’t opposed to the use of a traditional GIS for exploration, but he wanted all analysis to be documented and reproducible through code. I thought this was a little restrictive, but as in turns out, it wasn’t his first rodeo. For literally every one of my “one-offs”, I found myself repeating the task again, and for some tasks many times over. By the end of the summer, I was committed to end-to-end analysis with scripting.
A note about reproducibility
Also during that summer, our research group was tasked with building a kriging library in MATLAB. The available tools at the time weren’t sufficient for our needs, so we needed write software from the ground up. At the time, the industry standard software in soil physics was MATLAB (it might still be), so that’s what we used. Since Esri documents the formulas used in various ArcGIS tools on its help site, we used these as a guide along with various academic papers. As we produced results from our library, we would check these results against those produced with ArcMap. Time and time again, we could not get the results to match up. The differences were subtle but clearly there. Many of us painstakingly reviewed the code and ensured the mathematics were correct; we couldn’t find errors.
Eventually we had to move on, because though we could visually compare results with ArcMap, we certainly could not compare our code to theirs since ArcMap is proprietary and closed-source. We felt confident in our code, however, and we had to assume that ArcMap was doing something different behind the scenes from what their documentation claimed. The results weren’t terribly different, but it easily makes one wonder - what other tools are using different formulas from what the documentation says? And could these discrepancies be critical in some situations?
It may be tempting to think that small inconsistencies or minor analytical mistakes wouldn’t have real world consequences, but overwhelming evidence suggests otherwise. The (in)famous Reinhart–Rogoff controversy originating from mistakes discovered in their economics Growth in a Time of Debt paper perhaps best exhibits this in the academy. The paper had the opposite conclusion when a grad student found 29 countries mistakenly omitted from the calculations on an Excel Spreadsheet; in the mean time, countries used the results of this paper to justify austerity policies. To date, the paper has over 4000 citations. Other travesties stemming from irreproducibility have been well-documented too. For private companies, these issues have led to financial losses in the billions. 2
Can’t script a decent looking map…or can you?
But what about cartography? During my summer with the soil physicists, we used MATLAB and the MATLAB Mapping Toolbox to create maps, and the maps produced with these were clearly of lower quality than what could be produced in ArcMap and Adobe Illustrator. Toward the end of the summer, Jason got me interested in GNU/Linux and I started experimenting with more open source software, with the goal of finding a FOSS GIS for mapping. After several previous failed stints of attempting to use QGIS, I started using it for cartography.
Fast forward another year and I had a soul crushing cartographic experience that destroyed my capacity to use point-and-click programs to create maps. In a Geospatial Analysis II class assignment, we had to use various kernels on multiple variables to explain spatial autocorrelation results and create one map for each. It ended up being something like three variables with five kernels (so 15 maps), which was not entirely unbearable. After creating these 15 maps I was exhausted but relieved to not have to do that again.
In a course project for that course, I chose to explore spatial autocorrelation on a different dataset and was presented with the same problem: needing to produce nearly identical maps – same legend title, color scheme, north arrow, scale bar, etc. – except with more variables. After creating a plethora of maps at the end of the project, I found outliers which needed to be removed. In re-ran the analyses and created the maps again. I then discovered that different bandwidths produced better results, so I created the maps again. I did this several times and the monotony was a lot like what I imagine a lobotomy would feel like, though the process would be much more tolerable if I indeed had received a lobotomy beforehand.
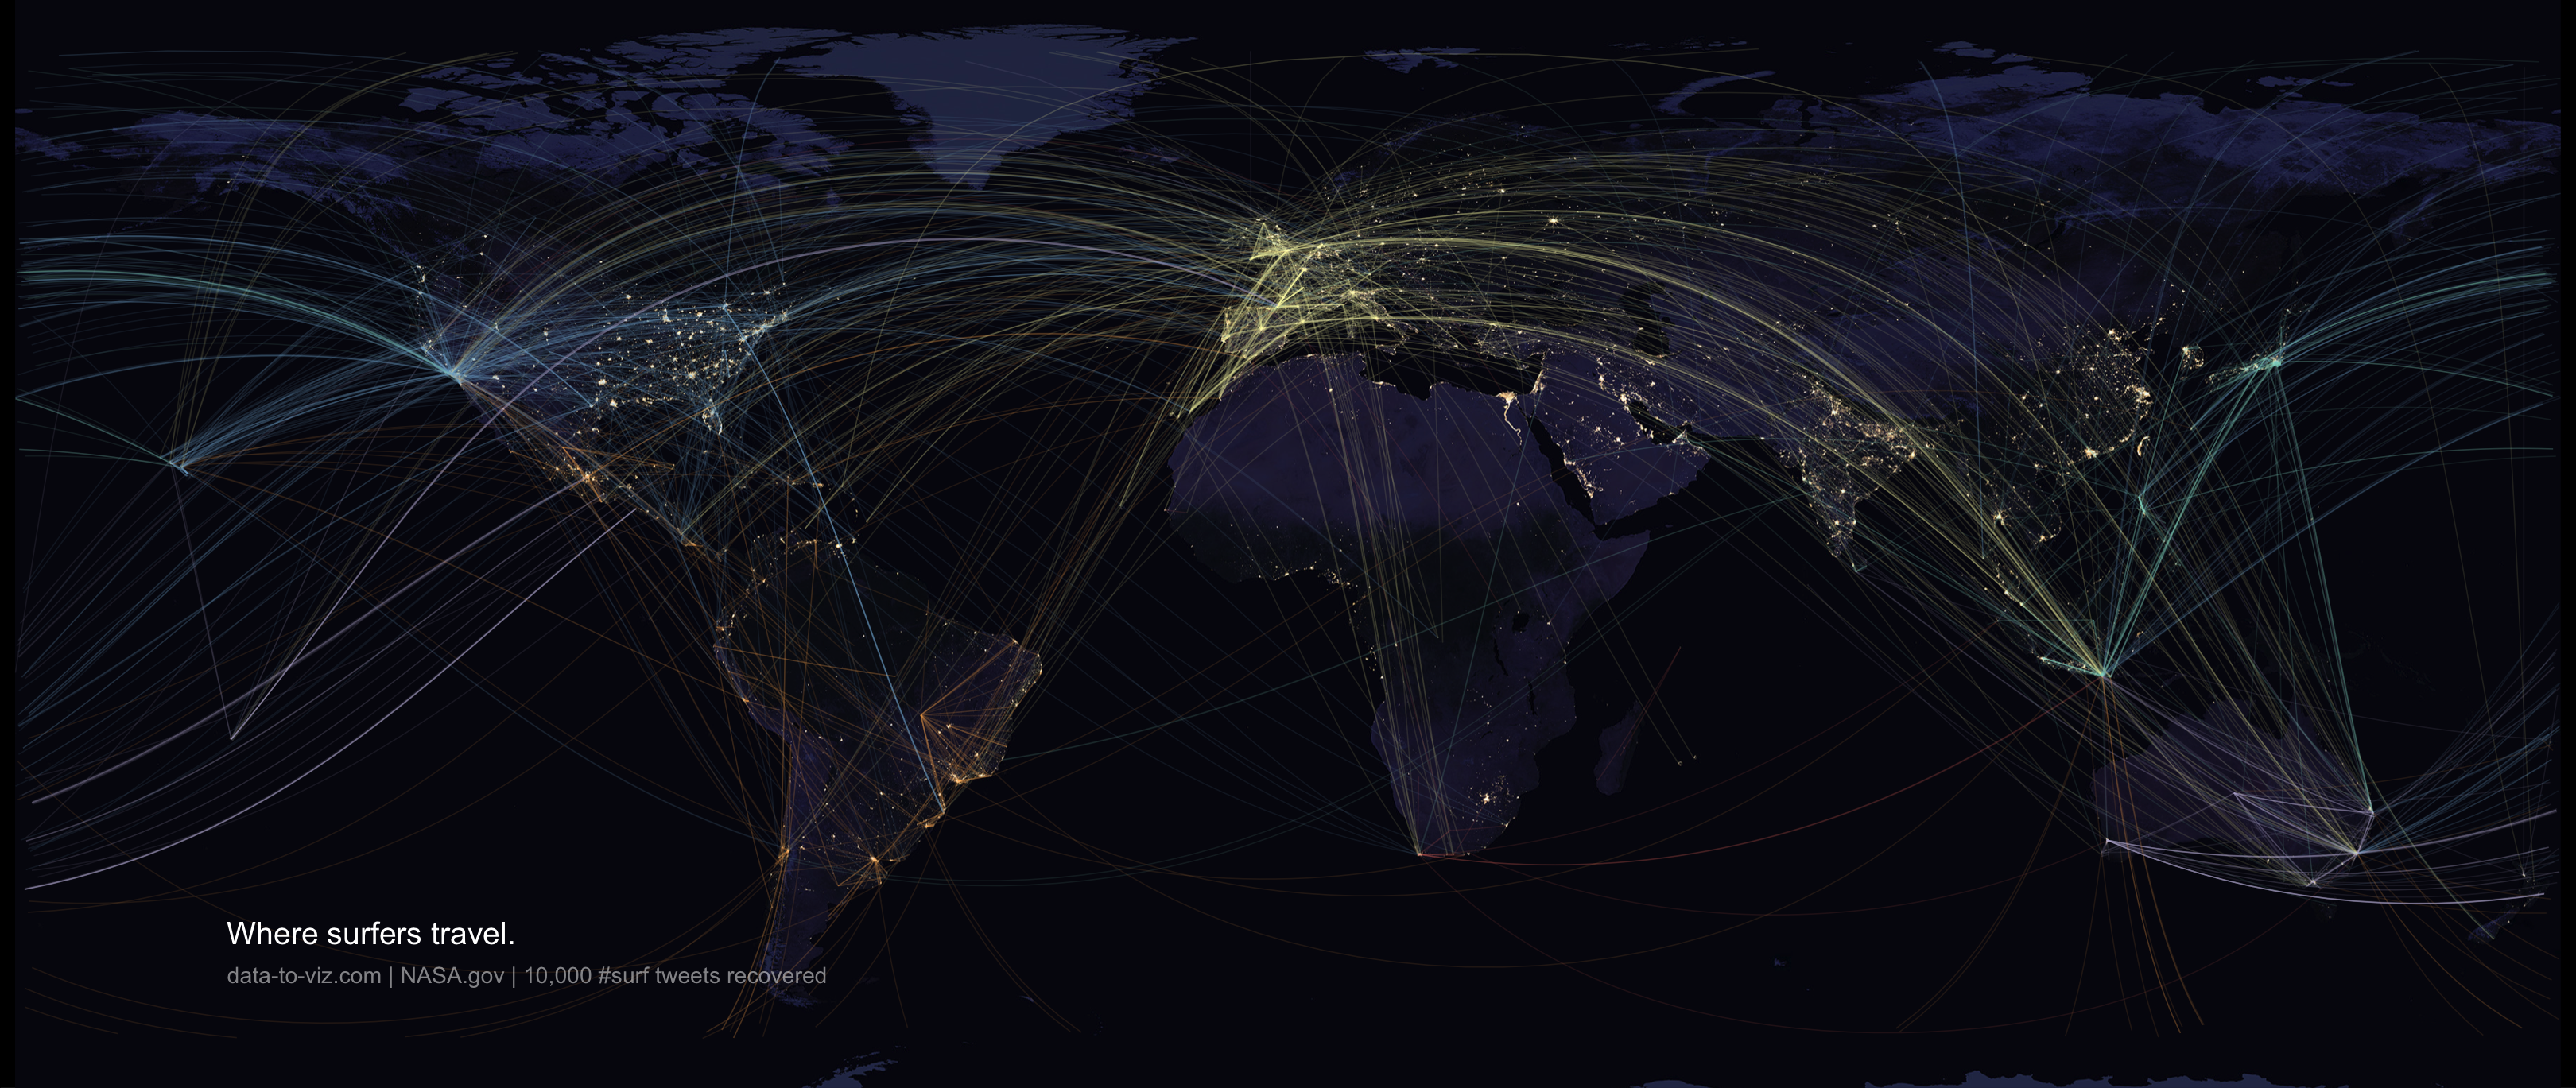
Figure 3: One of my favorite maps made with code. Cartography by Yan Holtz, not by me. I often use this as an example of what can be done cartographically in R.
It could be argued that I simply should have had “all my ducks in a row”, with regard to having the analysis “complete” before mapping. But that view is problematic on a couple counts and not representative of how the scientific process works. First, mapping is an important visualization technique that helps elicit patterns from data, and those patterns can be explored through analytical methods. It shouldn’t just be used at the end of project but throughout. Second, it’s not realistic to assume that a project can be reasonably completed without needing to make analytical modifications. Perhaps for a short homework assignment this is true, but in all of my journal submissions, I’ve never had an experience where reviewers let me off the hook from making analytical modifications, removing outliers, or using additional methods. In all of these cases, maps must be re-created in order to convey the analytical message.
Cartography can be a form of art, one in which the map is the final product. In these cases, a point-and-click program may be unavoidable, or perhaps desirable. In a research context however, maps are tools used to explain the analysis, and the analysis and its ensuing discussion points are the final products. In instances where one must create many similar looking maps to explain an analytical result, the cartographic workflow is simply a means to an end, with little value apart from the analysis itself. When cartography is conducted with scripting, not only is one able to easily reproduce maps when changes are made to the underlying data (i.e., one simply runs the script again), but that labor is beneficial to other projects as well. I now have dozens of publication quality maps as examples to draw upon when embarking on projects which need new maps. Many times these can be modified slightly and reused. Sometimes I have to create a new script from the ground up, but it is motivating to know that the work I’m doing in the present will almost surely save me time on a project in the future. And if a reviewer asks me to re-create something, it’s easy to do so.
The gift of R
In Spring of 2016, I took a Non-parametric Methods course in the Department of Statistics with Dr. Tamer Elbayoumi. He made us use R and conduct statistical tests without using external libraries. While this is not ideal in a research or industry environment, from a educational perspective this was remarkably helpful. Today, I gravitate toward non-parametric methods because I fundamentally understand them better than others as a result of this approach, but besides this facet, there was a greater gift this professor left me.
After a week or so of using R, I asked if it could handle spatial data. The instructor replied with a smile: “Yes. And once you begin using it, I am certain you will use it for all of your analyses.” I nodded enthusiastically but internally said, “lol yeah right.” I had heard this claim before – the previous semester I had taken a SAS class in the Department of Marketing at the suggestion a good friend, and both he and the instructor made similar claims (the class was a disaster and SAS is a terrible, antiquated language). I again thought this was another person who didn’t know my field well enough to understand the types of problems I was tackling. I liked Dr. Elbayoumi a lot, but I was keen on again showing someone the complexity of GIS and demonstrating the inabilities of this weird, yet fun, little statistical programming language.
So I started conducting some of my dissertation work with R, and decided to stop when it couldn’t achieve what I wanted. And I literally never stopped; I have been using R ever since. He was right, and even though R is a completely different language today than it was just even five years ago (more on this point later), it had everything I needed to conduct my research. I was under the impression that Python was superior and far more commonly used, and regardless of whether or not that was true, I was blown away by R’s spatial capabilities.
Today, I still do 70%+ of my work with R, with the other 30% being a combination of Python, Bash, and Emacs Lisp – and these other languages are mostly used for non-spatial tasks. While I don’t think R is the right choice for every spatial analysis problem, it’s certainly more than adequate for the vast majority of my problems.
![]()
Implications for geospatial practitioners
Sub-par approaches and the view from the inside looking out
With scripting, there is always more than one way to skin a cat, and most of the time there are 30 or 40 ways. When I look back at the various ways in which I have attempted scripting with spatial data (and programming more generally), I’m surprised I stuck with the approach. Let’s review (what I consider to be) serious missteps in my exposure to scripting:
My only three credit programming class as an undergraduate, Visual Basic Programming, was the class in which I received my lowest grade in my entire college career. Today I cannot stand this language or its development environment.
My graduate level GIS Programming class used
arcpywhich is awkward and cumbersome. Simple tasks like updating attribute tables or creating new fields are a total debacle.While working with the soil physicists, MATLAB was essential (it’s the industry standard in their domain), but the MATLAB Mapping Toolbox feels unnatural compared to Python’s
geopandasand R’ssfclasses, and there is far less help available for MATLAB as compared to other languages.In the SAS class I mentioned earlier, the instructor told me about a SAS bridge for ArcGIS; she even demonstrated it in class one day. Knowing that
arcpywas virtually unusable, I explored this as a viable scripting alternative. Spoiler alert: it’s not.Early on in my dissertation, I used PostgreSQL/PostGIS to store data and conduct analysis. While PostgreSQL is a great option for long-term data storage of tabular data, it doesn’t have user-friendly programming framework, and I now believe it’s much better to store data here and query from Python or R.
In my early days of using R,
spclasses were all that were available; today, the simple features (sf) package and corresponding standards have made life incredibly easier.
I feel bad for GIS students who are new to scripting because (1) there are
numerous approaches and many ways to go wrong, (2) even if students are
suggested to learn what I consider an acceptable and user-friendly language
(Python or R) they are likely to select or be recommended a confusing approach
(arcpy) due to perceived industry needs, (3) even if they are suggested to
learn Python and stumble upon geopandas (yay!), their understanding of
scripting as a workflow will be less than if they had learned R and sf first.
Some people who have used R for spatial analysis but did so before the advent
of sf, dplyr, and the tidyverse have missed out a great opportunity
indeed, and if this is the case, they really haven’t seen what R can do.
Naturally someone in this camp wouldn’t see the value of R. The tidyverse
makes data analysis dead simple, and the magrittr pipe (%>%) operations make
R unmatched by any language for data analysis tasks, Python included. Further,
the integration of sf with R’s data frame type makes spatial data analysis
just as easy.

Figure 5: Analytical bliss incarnate
That said, users with advanced proficiency with both R and Python may call into question R’s usability from a software engineering perspective, and I think there is reasonable debate to be had there. Yet, at a certain level, I think that R and Python users – at least in the GIS world – have more in common than they realize. Both can agree on the approach, and that’s what I think is important. I’ve benefited tremendously from knowing both languages, and I’d recommend others learn both as well.

Figure 6: You see, they are friends
What can’t be done with scripting? Reflections on monetary value, self-actualization, and Candy Land
At this point, anyone well-versed in GIS should be able to point to a few spatial tasks which can’t be scripted. These include (1) editing, (2) digitizing, (3) georeferencing images, and (4) some forms of data entry, to name a few. 3 The following statement may come across as harsh since so many people in the GIS industry frequently undertake these tasks, but my contention is that these are things which people generally don’t want to do, even if they are necessary for making an organization function. The sheer monotony of these tasks makes it impossible to perform “deep work” – “activities performed in a state of distraction-free concentration that push your cognitive capabilities to their limits” 4 – which is a crucial element to finding value and fulfillment in one’s profession.
Making some analogies to games, data entry is a lot like playing tic-tac-toe. Georeferencing is akin playing Checkers. Digitizing is like playing Candy Land. These games can be mastered quickly and are not invigorating. If you haven’t played Candy Land in a while, take it from me - I’ve spent hours playing the game over the past few weeks, and that is not something anyone wants to do long term.5 The skill cap for mouse-heavy spatial data manipulation tasks is comparable to these children’s games. Someone with ten years of experience in editing and digitizing is likely to be only marginally more effective than someone with several weeks of experience.

Figure 7: If this game doesn’t make you a five point Calvinist, nothing will
On the other hand, scripting is like Chess, or even better yet, the game of Go. There are more possible moves in the game of Go than there are atoms in the universe 6, and people can spend their whole life progressing at these games. Georeferencing and digitizing are undoubtedly essential tasks, but those who want to avoid them can do so by building a different, more marketable skillset. Forget the idea that these are mundane “rights of passage” and must be completed by GIS professionals before getting to more interesting things. I don’t buy it, and no student reading this should either. While it’s true that the majority of entry level GIS jobs focus on mundane tasks and do not pay well – not nearly well enough for me to enthusiastically recommend them to students – I’ve seen enough counterexamples of students landing satisfying, well-paying (and in one instance, extremely high paying) jobs to know that an alternative is possible.
Put in non-children’s-games terms, much of the knowledge required for using push-button tools more broadly – in addition to just spatial data manipulation tasks – is derived from the low levels of Bloom’s Taxonomy: knowledge and comprehension. Experience is gained from exposure, often in the form of following step-by-step instructions. To use a tool is to be competent with it, or so we’re led to believe. Scripting, on the other hand, is different. It requires higher levels of Bloom’s Taxonomy – analysis and synthesis – and a greater understanding of underlying methods. Most problems cannot be solved by following simple step-by-step instructions, and I think this is a good thing. Regardless of whether or not you are enticed by Chess or Go, deep work and higher levels of Bloom’s taxonomy are fundamentally more preferable than their counterparts.
When employees use expensive point-and-click GIS software particularly for spatial analysis, one has to ask what value the user brings from an organizational perspective. Is the user a creator or simply an operator like a person on an assembly line? Is the user adding value above and beyond what another person in their position could bring? Are they producing something unique and valuable? One need only look at the salaries and turnover rates in entry-level GIS positions to discern this.
It’s certainly possible to do mindless work with free software. And it’s also possible to do innovative and creative things with expensive software, but I contend that this doesn’t often happen with expensive GIS software 7. I don’t think it’s too far-fetched to suggest that for many organizations, GIS software brings far more value to organizations than the employees who use the software. I also think it’s reasonable to suggest that what entry-level GIS positions lack in salary is made up for in the bank accounts and cryptocurrency wallets of many a mid-level manager and software engineer in Redlands, California.
So what’s the solution to this conundrum if my contentions are true? I suggest this: work for organizations that derive value from the ingenuity of their employees rather than their software, learn how create tools and not just use them, and learn how the methods work rather than just how the software operates. In essence, learn scripting, and use scripting to master geospatial techniques rather than viewing software skills acquisition as an ultimate goal.
But who has time for scripting, really?
Serge Rey, a prominent open source advocate in the academy, claimed in a 2012 keynote address that one reason why academicians avoid scripting is because there is such limited time for research that programs with a low technical barrier of entry are essential 8. I think he is correct in that the use of point-and-click programs are justified in this way, but I contend that a lower barrier of entry does not equate to a lower time commitment, especially long-term.
Consider the case of extracting US Census American Community Survey (ACS) data and joining this to a geography, such as census tracts. Assuming a person has an understanding of what this data is and why this data might be important, let’s estimate the amount of time it would take to learn all skills necessary to extract the data and produce a map, without prior knowledge of a conventional GIS or scripting language. Assuming the person would need to learn some basic GIS, figure out how to join the table together, and create a map, I might estimate the total amount of time needed to build these skills at 40 hours if they are starting completely from scratch. After this initial learning phase, it’s reasonable to suggest that gathering new ACS data and creating a map for a different area might decline to 2 or 3 hours with some practice.
What about learning the necessary skills required for scripting the same task? If we include learning some basic scripting itself, exploring the intricacies of the US Census API rather than the GUI-driven web interface, and building the skills to create aesthetically pleasing maps, it might take 80 hours, maybe more. But the amount of time it would take to repeat this task would gradually decline to literally only seconds, and the scripts used for these tasks would have direct application to plenty of other problems as well.9 The initial time investment is greater, but the long-term time savings easily pays for itself may times over. For my own exploratory spatial analysis work, I now shudder to think about the laboriousness of retrieving Census/TIGER data in a browser and handling it in a point-and-click GIS.
We can quibble over the values assigned to the time commitments above, but I believe the general principle holds: scripting requires more of an up-front time commitment but a far greater return on investment in the long run. I think it’s useful to conceptualize the learning curve of these two competing approaches graphically, but some thorough explaining will be in order:
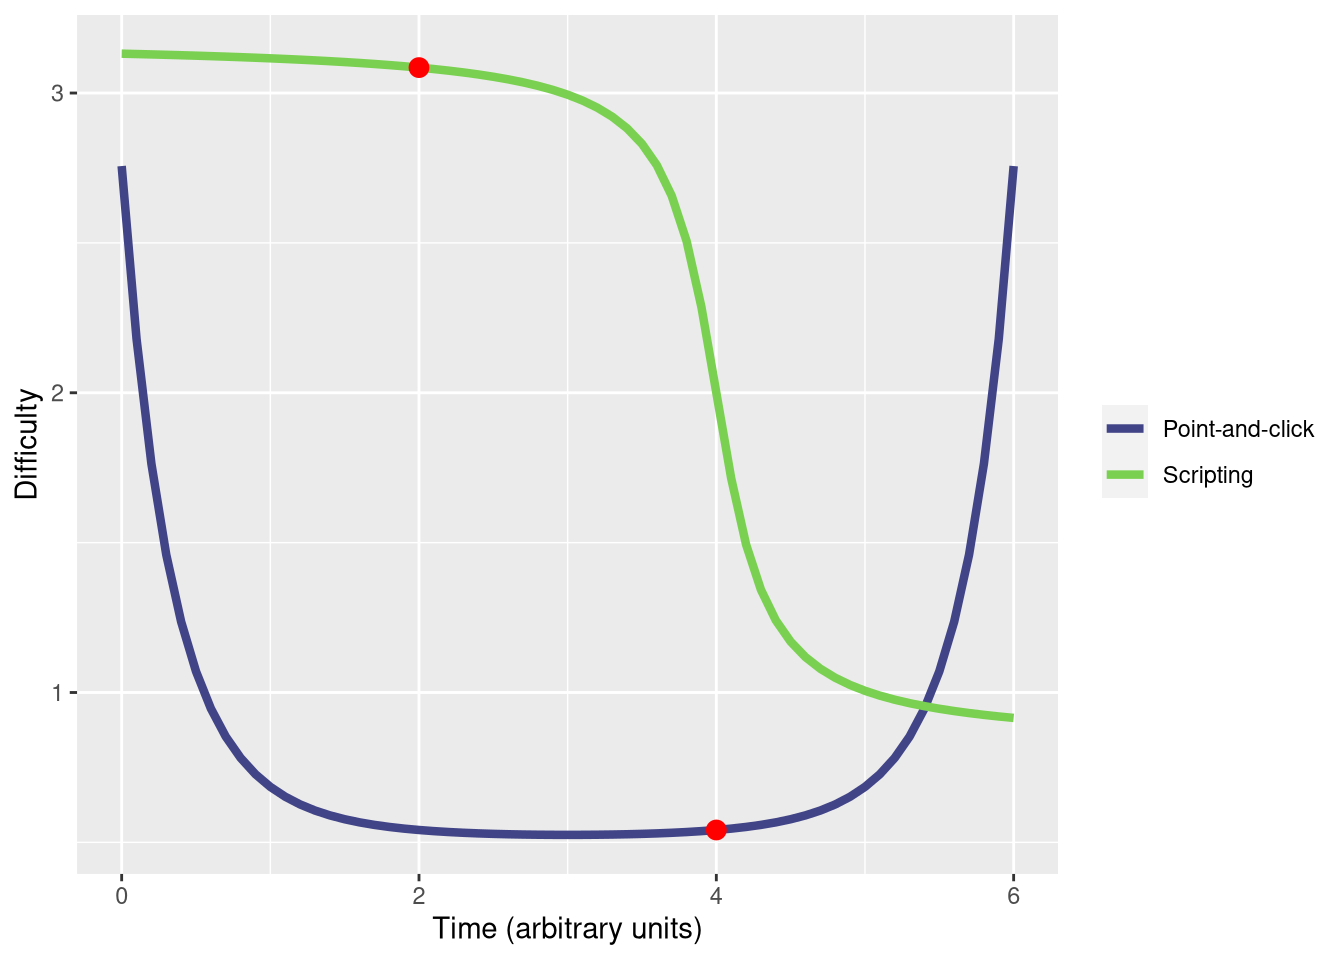
Initially, the perceived difficulty of point-and-click GIS (in the blue) is high (but not as high as scripting). Over time, this difficulty rapidly decreases to the point of feeling like (near) effortless work. The point on the blue line at x = 4 is where most advanced GIS education ends. Students feel competent with the software and it works well for them, so they don’t see the need to use something else. At some institutions, students may have the opportunity to progress to x = 5, where they start bumping up against some limitations of the software, but not to the point at which they feel the need for an entirely new approach. Yet, as they spend more time in the profession, a skilled practitioner will begin to find the limitations debilitating, to the point at which the software begins to feel more and more difficult to use.
Now consider the learning curve of scripting (in the green). This approach initially feels more difficult (and it is). Most GIS curricula stops exposing students to scripting at x = 1, if that, but some may progress to red point labeled x = 2. At this point, scripting is only marginally easier than it was in the beginning, and toward the of end of an undergraduate career, a student has progressed all the way to x = 4 along the point-and-click line. Scripting still feels more difficult (and it is). Over time, however, if one keeps progressing at scripting, the level of difficulty decreases asymptotically, but not to zero. Scripting never gets to the point of feeling mindless, and a skilled practitioner learns to bend the software to their will and enjoys doing so.
The resistance to scripting in the GIS community is not entirely without merit, however. In the early days of ArcGIS, customizations had to be written in C++, which is undoubtedly difficult for someone without computer science training, even today. Point-and-click toolboxes vastly lowered the barrier of entry, which is perhaps better than everyone have to use C++, but begrudgingly it has become so easy for basic operations that it is difficult to verify whether results created with such an approach are correct or not.
Now let me be clear: I am not suggesting that everyone build everything from the ground up with custom code.10 Far from this. I firmly believe in the “DRY” principle (do not repeat yourself), and fortunately languages like R and Python along with their scientific computation add-ons have hit the sweet spot between usability and reproducibility. I honestly believe that R and Python are not only more time efficient for spatial analysis but are actually far easier to work with than point-and-click GIS programs. It’s easier to organize workflows and understand how methods work. It’s easier to use the workflow from one problem and see how they apply (or not) to another problem. It’s far easier to extend and customize the software to fit it to one’s needs, but it undoubtedly requires a greater up front time commitment. What would student capabilities look like, however, if the structure of GIS curricula was such that instruction with each approach was stopped at the following points instead? I contend a curriculum could look like the following, with notably different end points for the two approaches:
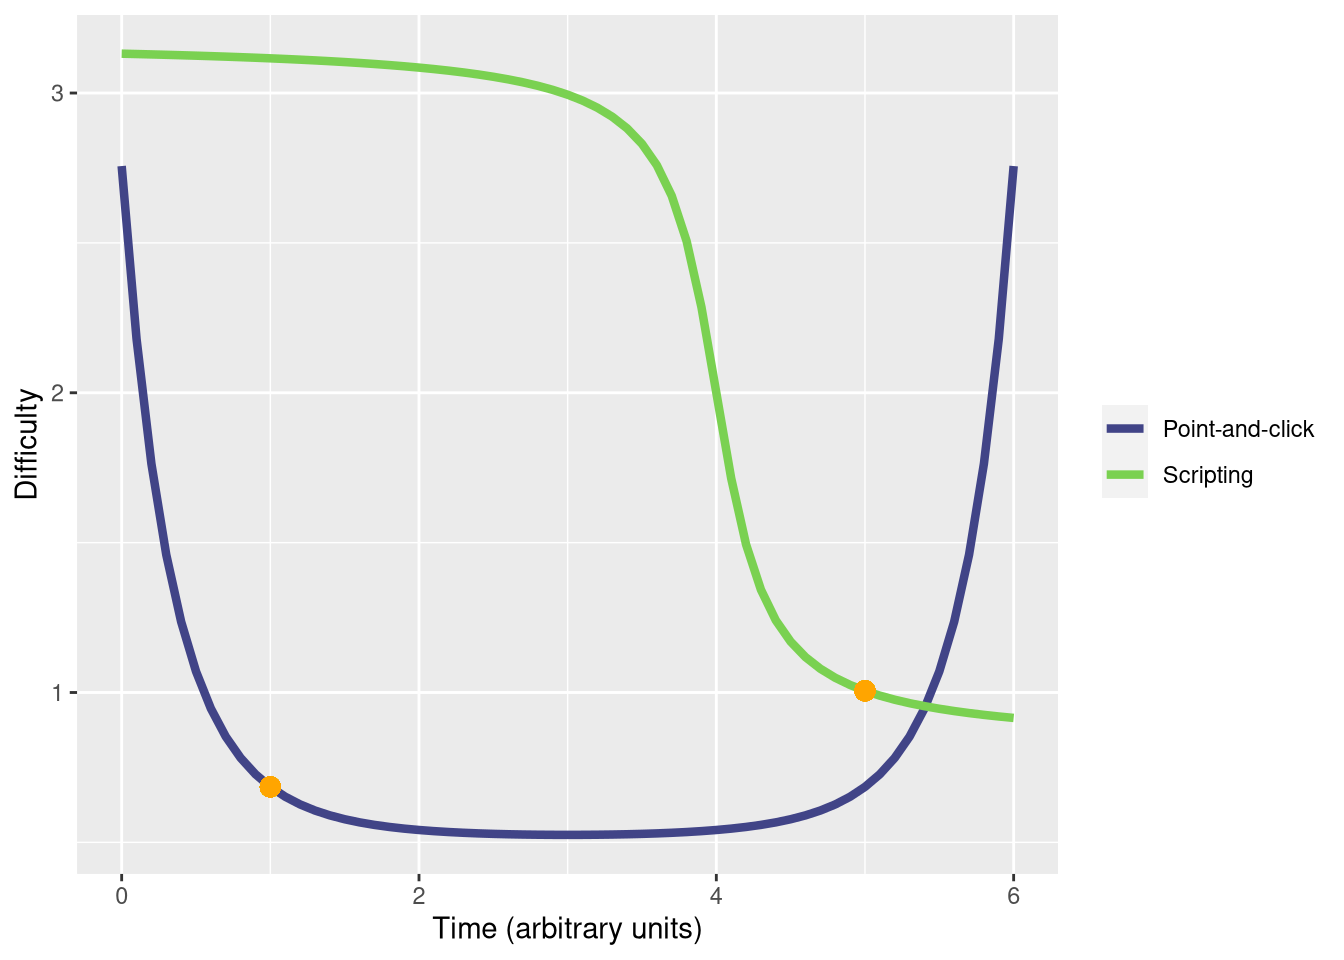
Figure 9: Learning curves of approaches to GIS with new proposed end points for each respective approach (at the points in orange)
Essentially, this would amount to a short introduction to spatial concepts with point-and-click tools, to the point at which a student would be competent enough to enter the workforce through an entry level GIS position or internship. Then, the “deep dive” into spatial analysis is conducted with scripting. This would involve a moderately period of legit struggling – maybe up to half a semester – which would be followed by an awakening leading to a state of geospatial transcendence. The air of our GIS labs would then glow with a brilliant radiance, and the ghost of Roger Tomlinson would descend upon us to bless each computer tower.
The point of this would not be to simply stop instruction once each approach “feels easy” but to equip students in the best way possible for future employment – long term and short term – while providing them with the skills to be lifelong learners. Something would have to give from what is covered in most point-and-click topic lists, however, and that thing may have to be the six hour advanced editing exercise in Chapter 12 of Mastering ArcGIS. Students would recover. Considering that the geospatial wizardry associated with each approach is a function of the inverse of its learning curve, this would be a fair long-term tradeoff. But it gets even better: the geospatial wizardry of scripting possess roughly a 3x multiplier against the inverse of its learning curve. Thus, the aggregate geospatial wizardy (i.e., the sum of y values at each respective group of points) is indeed much greater with a scripting-centric education, indicated by the points in orange, than with a point-and-click centric education, noted at the points in red:11
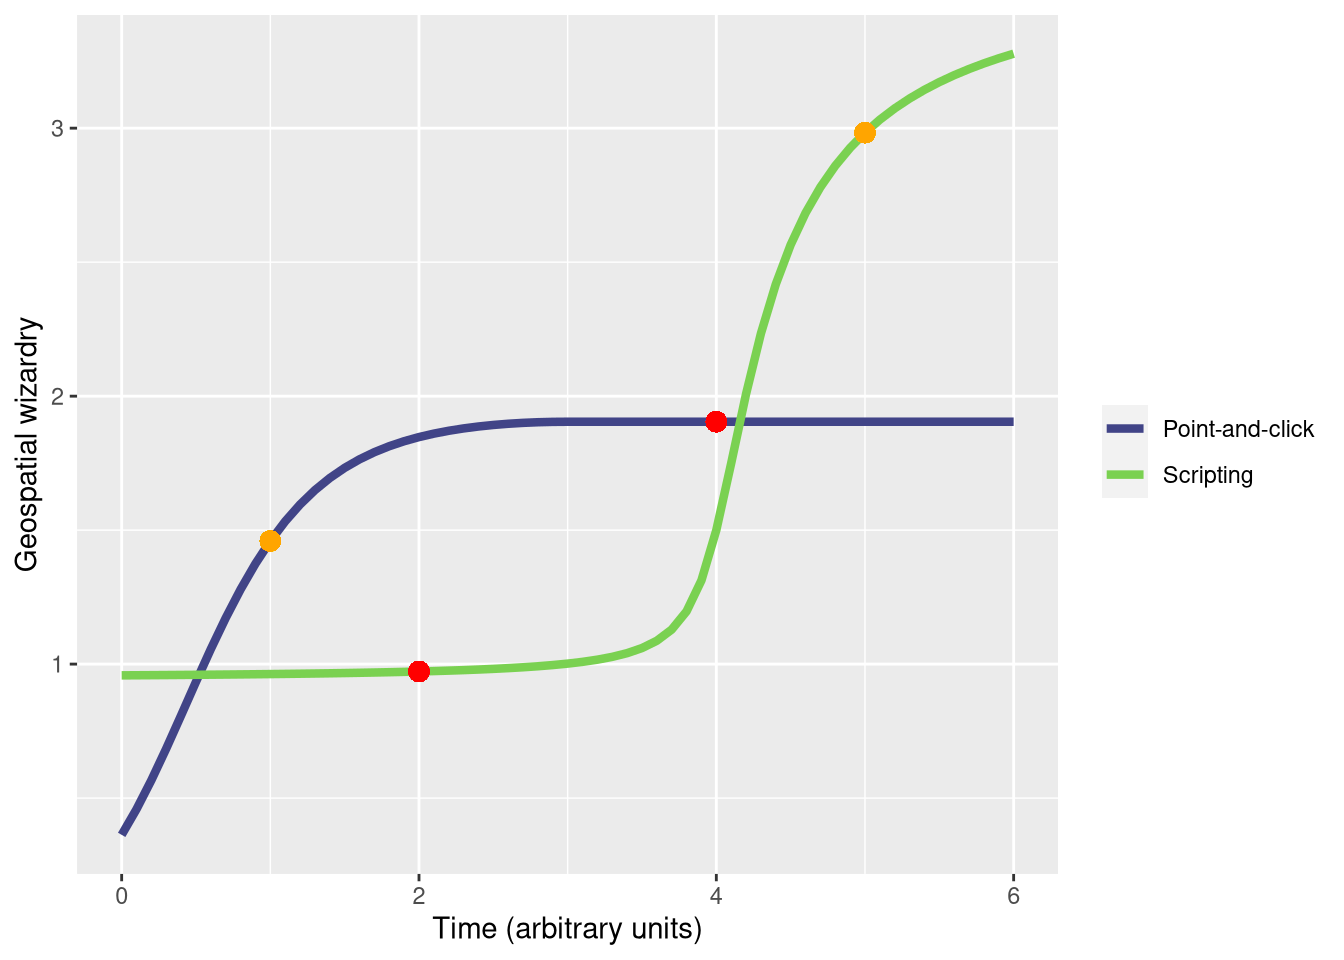
Figure 10: Level of geospatial wizardry achieved over time with two GIS approaches. Assuming six units of time (i.e., the sum of x values for the red points and orange points computed separately), aggregate wizardry (i.e. sum of y values for red and orange points computed separately) is much greater for the orange points.
It’s understandable that academicians and domain experts would gravitate toward expensive “out-of-the-box” programs, and for many in this category, the value in their specialized work is mostly derived from their domain experience rather than their spatial analysis skills. But if spatial analysis is one’s bread and butter – as it is for myself and many students studying GIS – the ability to capitalize on those skills is lost by using software which does the spatial thinking for you. And on this note, perhaps more important than time investment concerns is Serge Rey’s point that with point-and-click programs, research questions are constrained by the capabilities of the tool 12. Questions asked will be inherently limited by the lack in vision incurred by the proverbial black box.
And because of this, even for researchers and domain experts, I just don’t see point-and-click programs being in the long-term future scientific toolbox. Yes, ArcGIS and QGIS will still be installed on university lab computers for necessary data manipulation tasks, but papers won’t be published with these programs. Already, major journals inside and outside of geography – Science, Nature, PLOS Biology and the International Journal of Geographical Information Science to name a few – are requiring code and data to be submitted along with a written manuscript. It foreseeable that other journals will follow suit. If this is the case, as educators we have to ask ourselves – are we comfortable in solely or even primarily teaching students to use analytical tools with which they feasibly may not be able to publish? It’s doubtful undergraduates care about being able to publish a scientific paper with the toolset they use in a GIS 2 class – they are balancing a full schedule of World of Warcraft raids on top of other commitments – but if it’s not good enough for journals in the field, will it be good enough for private sector applications in the long run?
Conclusion and what I think this means for the field
As a student completing GIS assignments, it’s difficult to even conceive of a situation where one might work on the same project for months at a time or repeat the same GIS task five times a day for a week, let alone 80 million times. But take it from me and others in the industry: these situations abound. Yet this highlights a crucially important takeaway that has taken me many years to sift out.
First, GIS – as in “Geographic Information Systems” – is not an academic field. We’ve known that years, at least since the publication of Michael Goodchild’s 1992 piece Geographical Information Science.13 GIS is a tool, or more specifically, a type of tool or a set of tools. A GIS by definition is a computerized system using for managing, analyzing, and mapping spatial data (or something along those lines), though most of the time when the term “GIS” is used, people take that as shorthand for ArcGIS. My protracted epiphany is that the academy’s treatment of GIS as a field of study and the coziness with one particular GIS – one which does some things very well – has led to an extreme pedagogical over-emphasis on spatial data management, and it is high time to prioritize spatial data analysis, both for the sake of students’ future investment portfolios and for educators’ intellectual stimulation. That is best done with scripting.
GIS means vastly different things to different people. A GIS professional who sees a university GIS class being taught with software that they don’t use for problems they don’t encounter would naturally be confused or even taken aback by such content.14 This is why Goodchild’s conception of Geographic Information Science (GIScience) is so important. GIScience is not a tool or a software program; it’s a field of study which focuses on spatial data management, spatial statistics, ontology and representation, scripting and automation, ethics, cartography and visualization, analytics and modeling, among other topics. Traditional GIS work is only a small part of the field of GIScience, and a pedagogical focus on this minor subset does not provide students with a well-rounded education. GIScience topics are fault tolerant to software changes and do not become obsolete with the latest GUI updates.
Now I want to explicitly recap why scripting is crucial for geospatial professionals as elucidated in this piece:
Automation and conservation of labor: it’s far less work in the long run, and some tasks are simply not possible with point-and-click software.
Scientific reproducibility: it allows results to be verified.
Avoidance of mundane job tasks: those who know how to automate tasks are more valuable employees, and supervisors will not waste good employees’ time on boring tasks that could be completed by someone else.
Money: you will almost surely make more money with scripting in your toolbox than without it.
High skill cap with the opportunity for mastery experiences: this leads to fundamentally fulfilling work.
Future workflow investments: analysis begins to feel like something beneficial for future problems rather than just a box to check in the present.
Publishing requirements of journals: not every journal requires code and data, but many of the top journals do. It’s likely that more will follow suit. Especially important for graduate students, learning scripting gives one the freedom to publish in any outlet (except for ArcUser Magazine).
Research questions and analytical capabilities are no longer restricted by the tools at hand: scripting opens research doors that couldn’t be conceived of before.
It’s easier than pointing-and-clicking: most GIS professionals may vehemently disagree here, but I stand by this statement. I’d wager that most don’t have sufficient experience with scripting or, in my view, were trained improperly with scripting, to make a fair assessment on this point.
But what about for those who just don’t get scripting? Perhaps you’ve read this piece and are open to the idea that scripting is a desirable approach, but you doubt your ability. First, I’d like to say that you are in good company. I’ve been using R and Python for ten years and there are still plenty of things I don’t understand about these languages and others that I use. Professors who write computer science textbooks don’t know everything about the languages they write about either; they’re constantly learning too.
Or, perhaps you’ve noticed that my formative GIS experiences mostly came as a graduate student and you think these skills are unattainable for undergraduates. Again, I’ve seen many firsthand ,ounterexamples to this point. Having taken numerous GIS classes, taught three GIS classes with a variety of different approaches – ArcMap, ArcGIS Pro, ArcGIS Online, QGIS, R with sp class, R with sf classes, Python with geopandas, and Python with arcpy – my experience is that students understand fundamental geospatial concepts much better if they use scripting, but only if substantial time is committed to that approach. Ultimately, higher level geospatial concepts are much more accessible to undergraduates through scripting than with point-and-click software, and more than a few GIS students – at widely varying levels of academic ability – have told me that they never understood GIS until they started scripting. I can say this is certainly true of me.
Regardless of when you start scripting, you will get stuck. You will feel lost. You will get frustrated. But persevere and you will figure it out eventually. And as a result, you’ll be a much more marketable employee, GIS will come alive in a way that it hasn’t before, and you’ll be enriched by the experience.
Footnotes
I’ve written elsewhere on why arcpy is generally not a good approach for spatial tasks.↩︎
See Microsoft Excel might be the most dangerous software on the planet among others.↩︎
However, even though these tasks cannot be scripted directly, there are methods being employed to do this work without the manual labor. Consider building footprints: instead of manually digitizing these using a GIS and a base image, tech companies are now using deep learning and object segmentation to produce the footprints instead. For many in the GIS industry, taking years to become proficient with deep learning in order to create building footprints may be impractical or undesirable, even if it would be beneficial. For the sake of the arguments in this piece, I’ll assume that editing, digitizing, georeferencing, and data entry are tasks which cannot be scripted.↩︎
See Cal Newport’s 2016 book Deep Work.↩︎
I play Candy Land since my kids like it, and spending time with them is important, but my goodness…. the whole time I admittedly can’t stop thinking about how easy it would be automate the game and complete all actions with a simple script.↩︎
See AlphaGo: Mastering the ancient game of Go with Machine Learning.↩︎
For those thinking that good software must be expensive, I’d point to the Linux kernel which serves as one of many possible counterpoints. It’s the largest software project in the world. It powers 70% of smart phones, the vast share of web servers, and virtually all supercomputers. Bill Gates used to propagate this errant idea but has made a definitive U-turn.↩︎
Open source spatial analysis: lessons for research and education from PySAL↩︎
I once demonstrated to a GIS 1 class how I gather data from the U.S. Census using R’s
tigrisandtidycensusafter students had turned in a lab following the manual web interface approach. They were furious. They thought I was intentionally holding out on them. It’s possible that I’ve vastly underestimated the amount of time it takes to do this manually.↩︎This is impossible, though some novice software engineers will claim that they prefer this approach (even though they aren’t writing in Assembly or machine code)↩︎
We can caluclate aggregate wizardry directly since these plots were made with R and
ggplot2. The values are 2.8770221 and 4.442578, respectively.↩︎Open source spatial analysis: lessons for research and education from PySAL↩︎
I also see a major rift between what GIS professionals think a GIS education should be (job training) and what academicians think it should be (education).↩︎