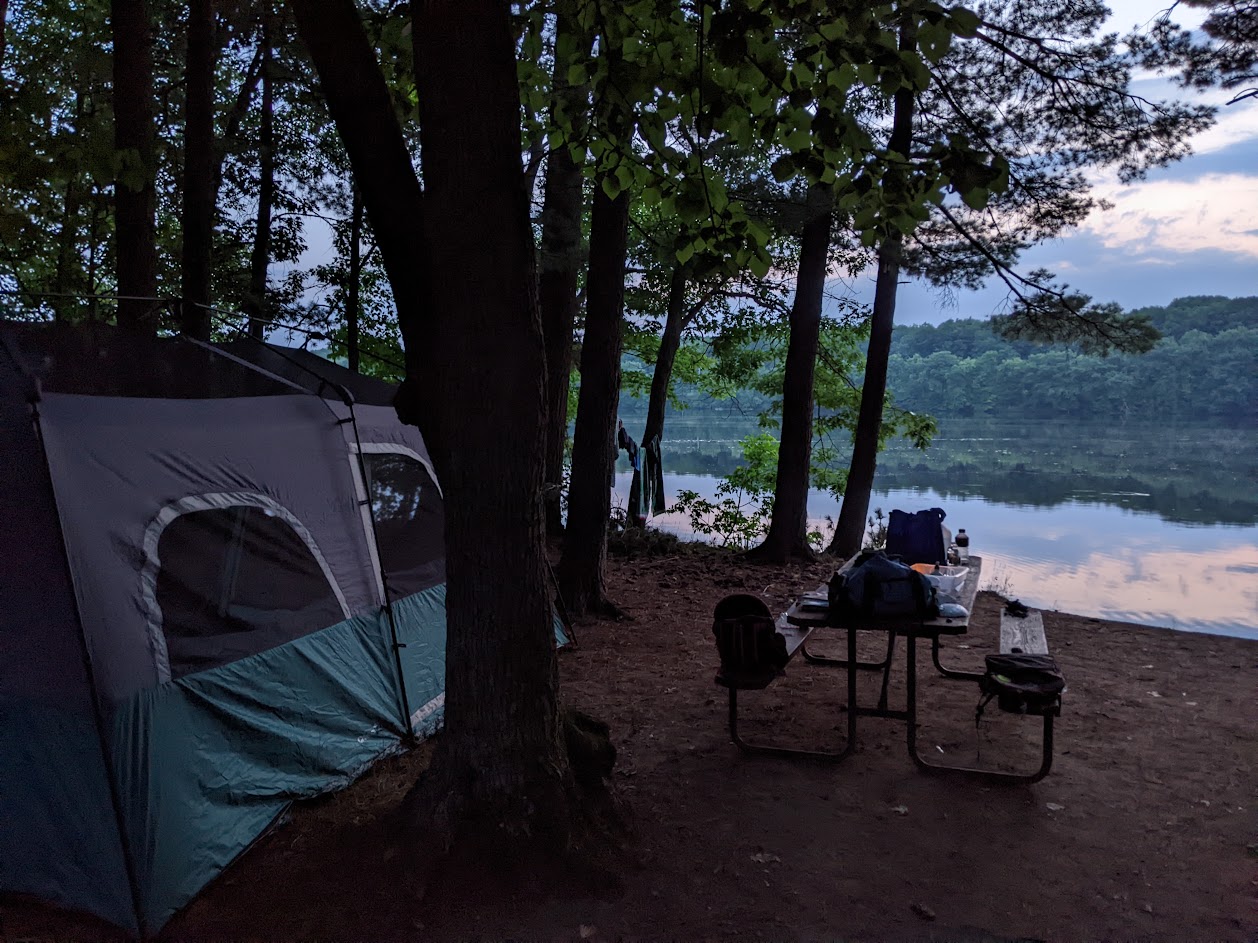
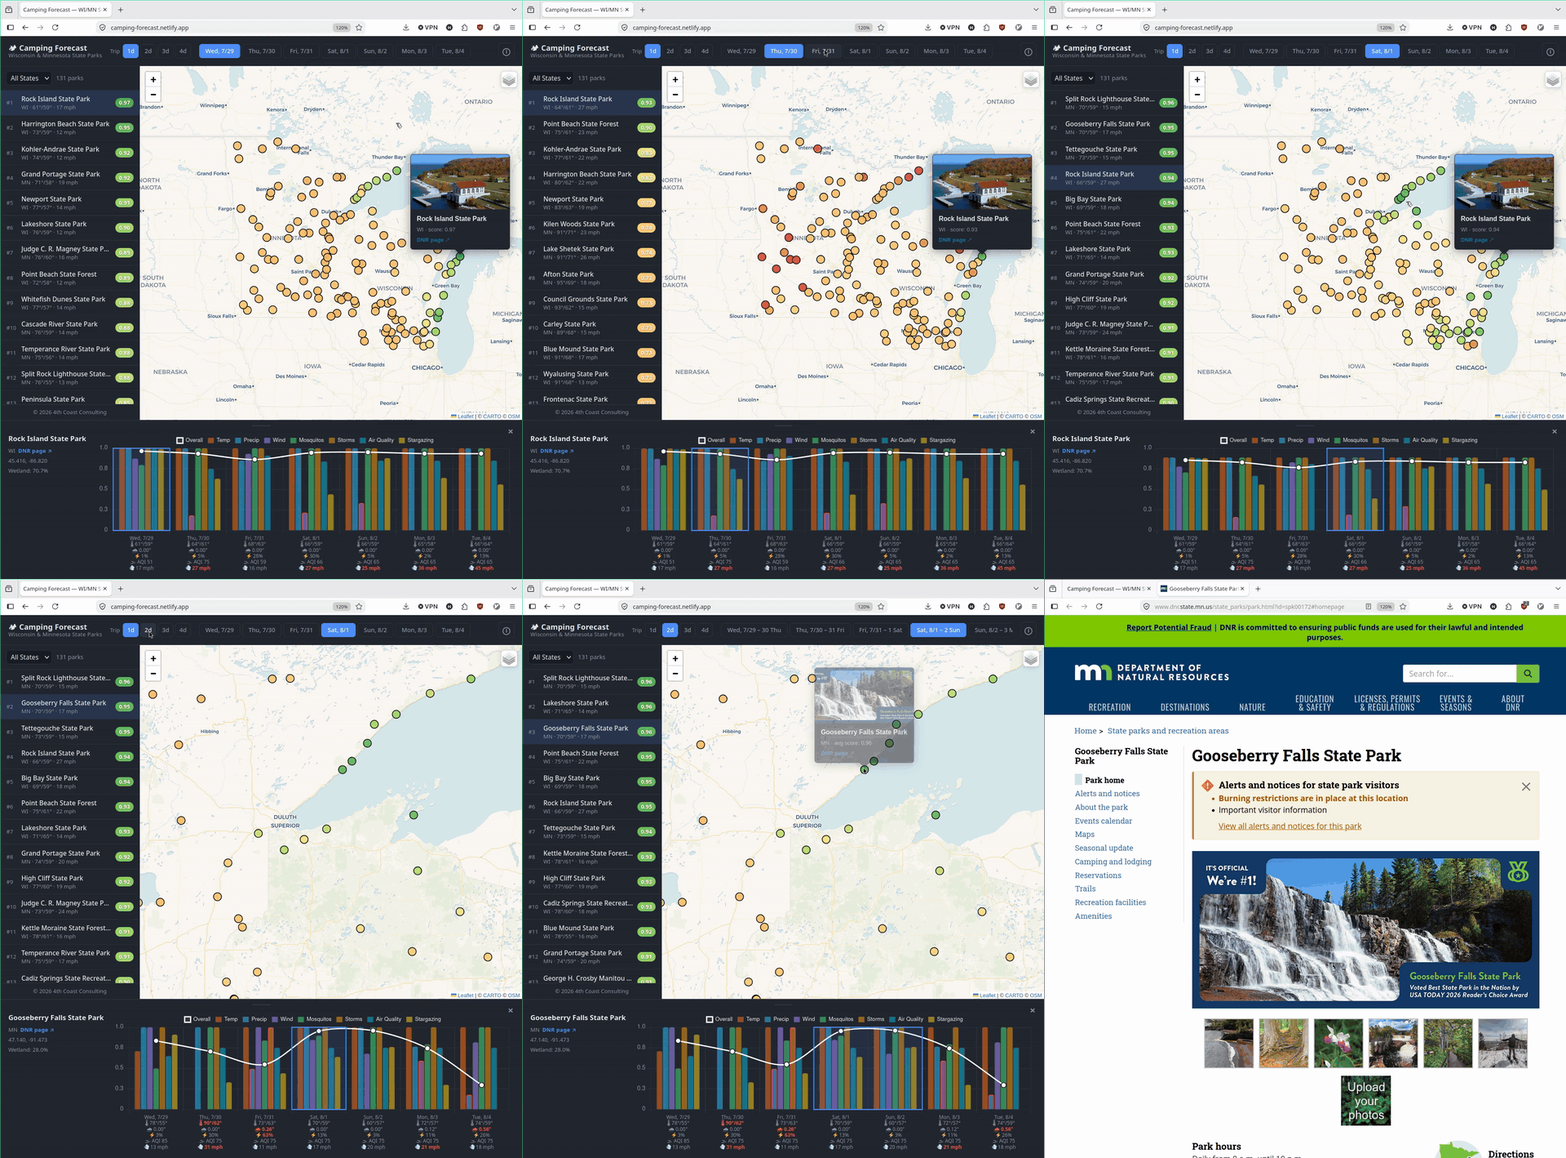
Every summer my goal is to take my kids camping at least twice. We always use a tent, and I hate camping in the pouring rain, extreme heat, or suffocating air quality (sadly now a common summer limitation), and I also like to avoid mosquitos if I can. I’m fortunate that my summer schedule is pretty flexible, so if the conditions are right we can plan a trip a couple days out and leave at the drop of a hat. I wanted a better way to plan trips besides manually looking at forecasts at multiple locations over multiple days, often using multiple sources. This is time consuming and error prone (it’s easy to overlook air quality or mosquitos), so I built a web app that forecasts conditions at all 131 state parks, forests and recreation areas in Wisconsin and Minnesota over a seven day period, with options for multi-day trips.
Variables
The application creates a composite score between 0 and 1 that updates four times daily based on the following variables:
Temperature - scores highest when the daytime high is comfortably warm and the overnight low is bearable. The high sits at the maximum 1.0 between 55F and 77F and tapers off either side (78F still scores 0.94 – only a tad warm); the low temperature scores a maximum value at 45F and above, sliding to zero by 30F. The two multiply rather than average because a pleasant 70F afternoon does not redeem a 28F night in a tent. Dangerous temperatures are handled separately: a 95F high, a 40F high, an 80F low or a 20F low each drop the whole composite in half on their own, the same way hazardous smoke does.
Precipitation - Light drizzle results in a minor penalty. Heavy rain significantly drops the score.
Wind - Calm conditions score highest; a penalty kicks in above 15 mph (no tent stakes FTW).
Mosquitos - A higher score means fewer mosquitos. This is the most complicated variable in the dataset since it aggregates a wetland fraction based on a buffer around each park intersected with 2021 NLCD data, 14-day accumulated precipitation, temperature, and humidity.
Storms - A thunderstorm code in the forecast (WMO 95/96/99) opens a penalty, and the chance of precipitation that day scales how hard it lands. A 25% chance of storms slightly penalizes the score; a 90% storm drives this variable to close to zero. Storms and rain also gate the whole composite, so a high-confidence storm drags every other variable down with it (temperature and mosquitos don’t matter much much when you are setting up a tent in lightning).
Air Quality - This variable combines Open-Meteo’s modeled AQI with EPA AirNow observations, taking whichever is worse. An AQI ≤ 50 (Good) returns a 1, an AQI ≥ 150 scores a zero, and hazardous smoke (AQI 150–300+) pushes the composite score toward 0, similar to storms.
Stargazing - I own a sorely underutilized telescope, and it’s nice to sleep with the rainfly off (which somehow usually causes rain in itself) and enjoy the stars. This variable is shown in the detail chart based on cloud cover, but not included in the camping score since cloudy nights don’t ruin a trip.
Infrastructure
This app was created without touching a SINGLE GUI – no AWS Management Console, no GitLab settings page to create environment variables, no manually connecting a project to Netlify. It used:
- GitLab CLI/API to set up the pipeline
- AWS CLI/API to publish data sources and expose an API for the data
- Netlify CLI/API to publish the website
- pass, the standard Unix password manager, to keep API keys and tokens in GPG-encrypted files
Since I hate using GUIs, this turned out to be quite a fun data engineering exercise. Here’s what every piece of the stack does and how the data gets retrieved and aggregated:
GitLab CI as a cron server: three Python scripts run on a GitLab schedule, 4 times a day at 02:00/8:00 AM/PM to align with the GFS weather model. A full run takes ~48 seconds, which comes out to 96 minutes/month (about a quarter of GitLab’s free tier). This is the cheapest cron + compute server I know of, and it is good enough to even conduct kriging (!!!).
S3 for data storage: No need for a database in a project like this. The pipeline writes one JSON file with current scores (all variables plus composite) to S3 and a dated parquet archive of each run. The park photos were scraped once from the WI and MN DNR sites and stored on S3 as well. 131 parks with 7 days of forecasting makes for small enough data that a flat file is a fine data structure, and S3 costs pennies.
Lambda + API Gateway to expose the data: It reads scores.json from S3 on cold start, caches it at module scope, and serves three routes with CORS headers. All the scoring and calculations already happened in the GitLab CI pipeline, so the API’s only job is to hand over the result. Technically this step could be bypassed if the web interface were the only product, but I wanted to leave the door open for others to access the data via API if there was interest.
Netlify for web hosting: The site is static HTML with one JS file and one CSS file. Leaflet renders circle markers colored by camping score, and Chart.js draws a 7-day detail panel with a grouped bar chart per factor with the composite score as a line overlay. GitLab CI deploys it on push to main.
Total cost
Currently about $0.005 / month
Less than the value of a coin that no longer exists.
GitLab CI and Netlify are inside their respective free tiers, Open-Meteo and AirNow are free to access, and S3 and Lambda are less than a cent a month. I could have set up more of this through AWS to keep the infrastructure consistent (e.g., EventBridge Scheduler into a Fargate task), but this would have drastically inflated the cost (to $0.02 / month [!!!!]). Funny enough, triggering the Cost Explorer API at $0.01 per request actually incurs more cost than the monthly total of the entire pipeline and app themselves.
Observations/limitations
It’s pretty surprising how much variability there can be between parks at times. I’ve observed cases where the majority of both states are in the red (very low scores) while there are still pockets of locations with great camping conditions.
A very obvious limitation to anyone who camps at these state parks is that sites are often booked out for months at a time (far beyond the forecast period), and most people don’t have the job flexibility to simply take a couple days off in the middle of the week, only a few days out. That said, for those who do have considerable flexibility, there are often last-minute cancellations at all of these parks – even the premium locations. And for those who don’t have flexibility, I think this tool can still be useful in helping people decide whether or not it’s worth it to go. Case in point: if the high temperature is 90 degrees, should you camp? What if the low temperature happens to be 50, there are clear skies predicted with a 10 mph wind, no mosquitos, and great air quality? You are camping. But what if the low is 78, there’s a 40% chance of thunderstorms (which magically increases to 110% the second you pitch a tent), and mosquitos are through the roof? Pass. This is also why a composite score is helpful as well.
The scoring system is obviously subjective and based on my quasi-preferences. I actually prefer it even a bit colder than the temperature score suggests – a high of 62F and a low of 48F are my ideal camping conditions, but I know most people (including my kids) prefer warmer temperatures. That said, the masochists who like the heat may balk at my upper-range temperature penalty, and for those who camp in a 4-bedroom/5-bathroom McMansion pulled behind a monster truck, my composite scoring system may not be relevant at all.
Speaking of temperature penalties, winter conditions were, for a time, very poorly calibrated. Temperature is only 22% of the weighted composite score, so a 22F January day still landed near 0.78 – a perfectly nice green dot – because every other variable was perfect: no mosquitos, no storms, clean air, and dry ground. So now extreme temperatures gate the whole composite rather than contributing just a slice of it, and that same January day will score a zero. That said, I am very interested in winter camping (though I haven’t tried it yet), particularly in significant snow, so I need to make a toggle switch for winter camping composite scores that reward (a) falling snow, (b) accumulated snowpack, and (c) low but not frigid temperatures (~25F).
Try out the app here! https://camping-forecast.netlify.app/